Users are blocking and deleting cookies due to a lack of trust in the AdTech industry and what happens with their data. To build trust, companies must adjust their data collection processes to be transparent and respect users’ consent choices. Advertisers and marketers need to adapt to new methods and technologies for tracking and targeting users across different websites and devices that help build trust with users.
The post How do Google’s Enhanced Conversions and Meta’s Advanced Matching impact analytics appeared first on Piwik PRO.
]]>SUMMARY
- Advertisers and marketers need to adapt to new methods and technologies for tracking and targeting users across different websites and devices that help build trust with users.
- Google and Meta have introduced Enhanced Conversions and Advanced Matching, respectively, to improve ad targeting and conversion tracking using hashed first-party data.
- The two technologies raise serious privacy concerns connected with the potential for reidentifying users, lack of proper user consent and Google’s and Meta’s ability to reuse the data for their purposes.
- Companies should consider other options that don’t breach user privacy, such as contextual targeting for ads or privacy-compliant analytics with vendors like Piwik PRO.
Privacy regulations such as GDPR and CCPA have significantly changed how companies can track and measure user interactions online. Additionally, the rise of adblockers and browser tracking restrictions limit the use of third-party cookies on the web.
Users are blocking and deleting cookies due to a lack of trust in the AdTech industry and what happens with their data. To build trust, companies must adjust their data collection processes to be transparent and respect users’ consent choices. Advertisers and marketers need to adapt to new methods and technologies for tracking and targeting users across different websites and devices that help build trust with users.
To mitigate the impact of these privacy-facing developments, tech giants have created their own solutions – Google has introduced Enhanced Conversions, while Meta has launched Advanced Matching. They aim to enhance conversion tracking by leveraging first-party data, earning them the nickname “cookies on steroids“. However, recent guidance from the Federal Trade Commission (FTC) suggests that these solutions are not as privacy-compliant as they claim. Using them comes with significant privacy risks: once the data is captured, it is out of the user’s control, giving Google and Meta unlimited possibilities to use it to their benefit.
Today, we will explore Google’s and Meta’s initiatives more closely, looking into how they work and how privacy-compliant they actually are. We will also discuss other solutions that companies can utilize to combine privacy compliance with effective leveraging of data.
Before we dive in further, let’s explain some security concepts that will be relevant throughout this article:
- Hashing involves changing data into a deterministic string that can’t be turned back into its original form without employing extensive resources.
- Salting refers to adding a random string of characters to a piece of data prior to hashing to add an extra layer of protection and guarantee a unique output.
- Time-to-live (TTL) counts the time until data becomes useless and needs to be refreshed or replaced.
What are Google’s Enhanced Conversions?
Google’s Enhanced Conversions are designed to improve the accuracy of conversion measurement by using hashed data from your website. Enhanced Conversions are part of the Google Privacy Sandbox initiative, which is Google’s attempt at developing measures to support advertising without relying on third-party cookies.
As part of Enhanced Conversions, Google captures the data that prospects input on your website when filling out a form or completing a purchase. Examples of this data include visitors’ names, phone numbers, and email addresses. The data is kept pseudo-anonymized with a hashing algorithm known as SHA-256. Through hashing, identifying information is transformed into a character string.
Once the hashed data is sent to Google, it is matched with signed-in Google accounts to attribute campaign conversions to ad events such as clicks or views. The platform can then attribute conversions across devices and platforms so advertisers can build retargeting audiences.
Note that the hashed first-party data referred to here doesn’t fit the standard definition of first-party data – instead, it is a concept created by Google. Google collects the hashed first-party data via gtag and doesn’t give advertisers direct access to it.
What is Meta’s Advanced Matching?
Like Google’s solution, Meta’s Advanced Matching leverages data from your site or app to enhance conversion tracking.
This feature is part of the Conversions API (CAPI), which is Meta’s response to privacy updates like Apple’s iOS 14 changes and the introduction of the App Tracking Transparency (ATT) prompt. The Conversions API allows advertisers to send data directly from their servers to Meta, bypassing the browser’s privacy features.
Advanced Matching enables a website that uses the Meta Pixel to automatically collect visitors’ data and match them with users on their platforms. If you use a form on your website, the technology gathers form data like email addresses and phone numbers, hashes it, and then transfers it to Facebook or Instagram.
Benefits of Enhanced Conversions and Advanced Matching
The two technologies come with several advantages for businesses:
Improved conversion tracking accuracy
By using first-party data, these technologies offer a more precise way to attribute conversions, even across different devices and platforms. This leads to better-informed marketing decisions and optimized ad spend.
Enhanced ROI
With more accurate conversion tracking, businesses can better measure the return on their advertising investments. This allows for more effective budget allocation and improved campaign performance.
Data security
Both Google and Facebook emphasize the privacy-safe nature of their solutions. Enhanced Conversions and Advanced Matching use secure hashing techniques like SHA-256 to anonymize personal data before transmission, safeguarding the data while enabling detailed conversion tracking.
Privacy concerns
Despite Google’s and Meta’s claims that their solutions are privacy-compliant, there have been serious concerns about the ethical implications of scraping and utilizing personal data for conversion tracking.
Many argue that while this approach can enhance ad targeting and conversion tracking, it may compromise user privacy. The balance between effective marketing and respecting user privacy is a critical issue that needs to be addressed to maintain user trust and comply with privacy regulations.
Here are some additional criticisms concerning privacy:
Potential for reidentification
The Federal Trade Commission (FTC) has highlighted that hashing does not fully protect user anonymity and can still allow user identification. Hashing transforms data into a unique string of characters, which can still be reversed or matched with sufficient computational effort and supplemental data. Thus, hashing does not fully anonymize the data, and businesses must remain vigilant in their privacy practices. This undermines the privacy safeguards that hashing is supposed to provide and raises concerns about how securely user data is being handled and stored by Google and Meta.
GDPR compliance
There are also concerns about GDPR compliance when using Google’s Enhanced Conversions and Meta’s Advanced Matching. GDPR mandates that personal data be processed lawfully, fairly, and transparently. Businesses must ensure data minimization – collecting only what is necessary for the intended purpose – and that they only use the data for the specific purposes for which consent was given.
Privacy experts argue that Google’s and Meta’s practice of scraping form data and using it for ad conversion tracking may not fully align with these principles, particularly if users are not adequately informed or do not have a straightforward way to opt out of tracking.
On top of that, even though the data is hashed, it does not eliminate the privacy risks associated with collecting and processing personal data without explicit user consent. Under GDPR, businesses must obtain clear and explicit consent from users before collecting their data and be transparent about how this data will be used. Consequently, companies that are subject to the relevant privacy regulations and want to adopt these technologies must ensure they obtain the necessary user consent.
Implementation challenges
Next to privacy concerns, Google’s and Meta’s technologies may come with implementation challenges. More advanced configurations require technical knowledge. Additional expertise might also be required to configure tags and manage data privacy settings. In practice, this rarely happens as decisions are left to those with technical knowledge of how both platforms work rather than privacy teams that should oversee the setup process.
Adding a salt to the wound
A salt is a random value added to the data before hashing, meaning that even identical inputs produce different hashes. Adding a salt to the hash could enhance privacy by making it significantly more challenging to reidentify users. This approach mitigates the risk of attackers using precomputed tables to reverse-engineer the original data, thereby providing stronger protection against reidentification.
However, this added privacy measure would lead to lost revenue for companies like Google and Meta. The reason is that salting would disrupt their ability to effectively match hashed data across different sessions and devices. Without consistent hashes, it’s impossible to track user behavior accurately and attribute conversions, which is critical for optimizing ad targeting and measuring campaign performance. Consequently, the precision of ad targeting would decrease, leading to less effective advertising strategies and reduced ad revenue for these platforms.
How hashing works in Piwik PRO
Google and Facebook operate an ad business, while Piwik PRO provides analytics. Hence we can’t directly compare their features. However, we’re still able to contrast their approaches to privacy.
Unlike Google and Facebook, which store hashed emails or phone numbers, Piwik PRO temporarily only links events with one visitor session.
Google and Facebook use hashed data to track and reidentify users across different platforms, such as websites and mobile apps. Meanwhile, at Piwik PRO, temporary linking is utilized for pre-consent data tracking to ensure user data cannot be reidentified across sessions.
Here’s how hashing works in Piwik PRO:
- Data protection: When users visit a site, their client device characteristics are hashed and salted using secure techniques.
- Active session detection: Piwik PRO maintains a session hash, which is a mechanism linking the visitor and session in memory for up to 30 minutes from the last update.
- No reidentification: Unlike Google and Facebook, Piwik PRO drops the link between the visitor and their session (usually after around 30 minutes, which is the session hash’s time-to-live (TTL)). This means that once the data has been processed – for example, a visitor’s session has ended – for its intended purpose – such as anonymized analytics – the session hash is discarded, making reidentification of the user impossible.
- User consent: Before any data that could identify a user across sessions is collected or processed, explicit consent is obtained from the user. This aligns with GDPR and other privacy regulations prioritizing user control over personal data.
This methodology ensures that Piwik PRO’s use of hashing adheres to privacy best practices, offering a robust solution for businesses that need to track user interactions without compromising privacy.
Experts opinion
Brian Clifton
Digital analytics and privacy expert
A business thrives by encouraging people to buy, subscribe, and make contact. A big part of that process is giving people plenty of reasons to trust you. A remarketing approach based on a surveillance economy breaks that trust. Contextual remarketing is an alternative – it has been around for decades and works without profiling your customers. Whether you use remarketing or not, I would posit that the gains of building long-term trust with your customers and prospects, will far outway the short-term benefits of remarketing by stealth.
The bottom line
Google and Meta are pushing advertisers to adopt their technologies – without that, they will lose huge amounts of data that they currently use for their own purposes to target individuals for ads.
Let’s not forget that having explicit and informed user consent makes it possible to track users through access to their hashed first-party data and send it to Google or Meta. However, each business should individually assess its compliance and whether they have valid consent for such data processing purposes.
Substituting third-party cookies with hashed first-party data, as applied by Google and Meta, carries privacy concerns. Businesses should be aware of the negative privacy implications of Google’s and Meta’s technologies and consider more privacy-friendly options rather than risk loss of customer trust.
Without hashed first-party data, it will be harder for companies to perform personalized advertising due to the limited ability to stitch user sessions together, resulting in less personalized ads, though contextual advertising alternatives do exist (ironically, Google was an early leader in the field of contextual advertising until it changed its approach).
However, businesses can still collect vital data with platforms like Piwik PRO Analytics Suite. They can successfully use it to optimize their website or app, improve user experience, and inform marketing campaigns or content initiatives. They’re also still able to run ad campaigns through Google or Facebook or turn to other forms of advertising, such as contextual targeting.
Learn more about using Piwik PRO with Google Ads:
Learn more about how you can effectively collect and analyze user data while maintaining privacy compliance with Piwik PRO:
Read more:
The post How do Google’s Enhanced Conversions and Meta’s Advanced Matching impact analytics appeared first on Piwik PRO.
]]>The post How to optimize Google Ads campaigns with Piwik PRO Analytics Suite appeared first on Piwik PRO.
]]>SUMMARY
- Google Ads offers great reach and impressive ROI, but successful campaigns require careful optimization and continuous refinement.
- Supplementing the data from Google Ads with analysis tools such as Piwik PRO enables an iterative approach to campaign optimization.
- Piwik PRO Analytics provides detailed insights into campaign performance, including metrics such as sessions, bounce rate, goal conversions, and revenue.
- Landing page optimization is crucial for maximizing advertising effectiveness, and Piwik PRO facilitates the analysis of landing page performance and user behavior.
- Piwik PRO’s custom segmentation and reporting provide deeper insights into audience behavior, enabling more targeted and effective advertising strategies.
- Integrating Piwik PRO CDP and Google Ads enables personalized campaigns based on first-party data, improving targeting and ROAS.
Google Ads has a reach of over 90% of internet users worldwide. According to Techreport, the return on investment for companies using this platform is an impressive 8 dollars for every dollar spent.
However, such figures are not easy to achieve. Managing a Google Ads campaign is difficult, and the results sometimes take time to crystalize.
Optimizing Google Ads campaigns, analyzing data, and developing a system for continuous targeting refinement are all art in themselves and require experience.
This is why you should not only rely on the information available in the Google Ads panel. You should also use other analytics platforms, such as Piwik PRO Analytics Suite.
The idea is to introduce an iterative process in which you repeat a cycle of experiments, data analysis, conclusions and improved methodology. Empirical data, allows you to optimize your Google Ads campaigns more efficiently, eliminate errors, and gain more confidence in your decisions.
This blog post presents tips and tricks for optimizing your Google Ads campaigns with Piwik PRO. These tools enable you to precisely determine your target group, track user actions, and quantify the effects of your marketing efforts.
Google Ads optimization using the basic report in Piwik PRO Analytics Suite
Start with the basic report in Piwik PRO Analytics Suite to optimize your Google Ads campaigns.
Once you integrate Piwik PRO with Google Ads, the report’s structure in the Analytics platform mirrors the workflow in the Google advertising platform. You move from the general level to increasingly detailed data.
Accounts
This report shows the Google Ads accounts that you have connected to Piwik PRO. If your company has branches in different countries, you can set up a separate account for each one. In this report, you then analyze the key metrics for each account individually. The table combines information from Google Ads:
- Account – Account name.
- Clicks – The number of clicks on your ad.
- Cost – The amount you have paid for your ads in Google Ads.
- Average CPC – the amount paid for your ad divided by the total number of clicks.
- CTR – The click-through rate measures how often visitors click on your ad in Google Ads after it has been displayed to them.
- ROAS – It shows whether the expenditure for Google Ads has been converted into sales.
with additional data from Piwik PRO Analytics, such as:
- Sessions – The number of sessions carried out by visitors. A session starts with the first event and ends 30 minutes after the last event that happened in this session.
- Bounce rate – The percentage of sessions in which visitors only viewed one page and did not move on to another page, goal conversion, or order.
- Goal conversions – The number of goals completed in a session (if you have set goals).
- Goal conversion rate – The percentage of sessions in which visitors completed a goal.
- Sum of goal revenue – The total of sales for a given goal.
The Piwik PRO Analytics Suite metrics allow you to see what happens after a click in Google Ads and whether it was a valuable click for you. We’ll take a closer look at this at the campaign level.
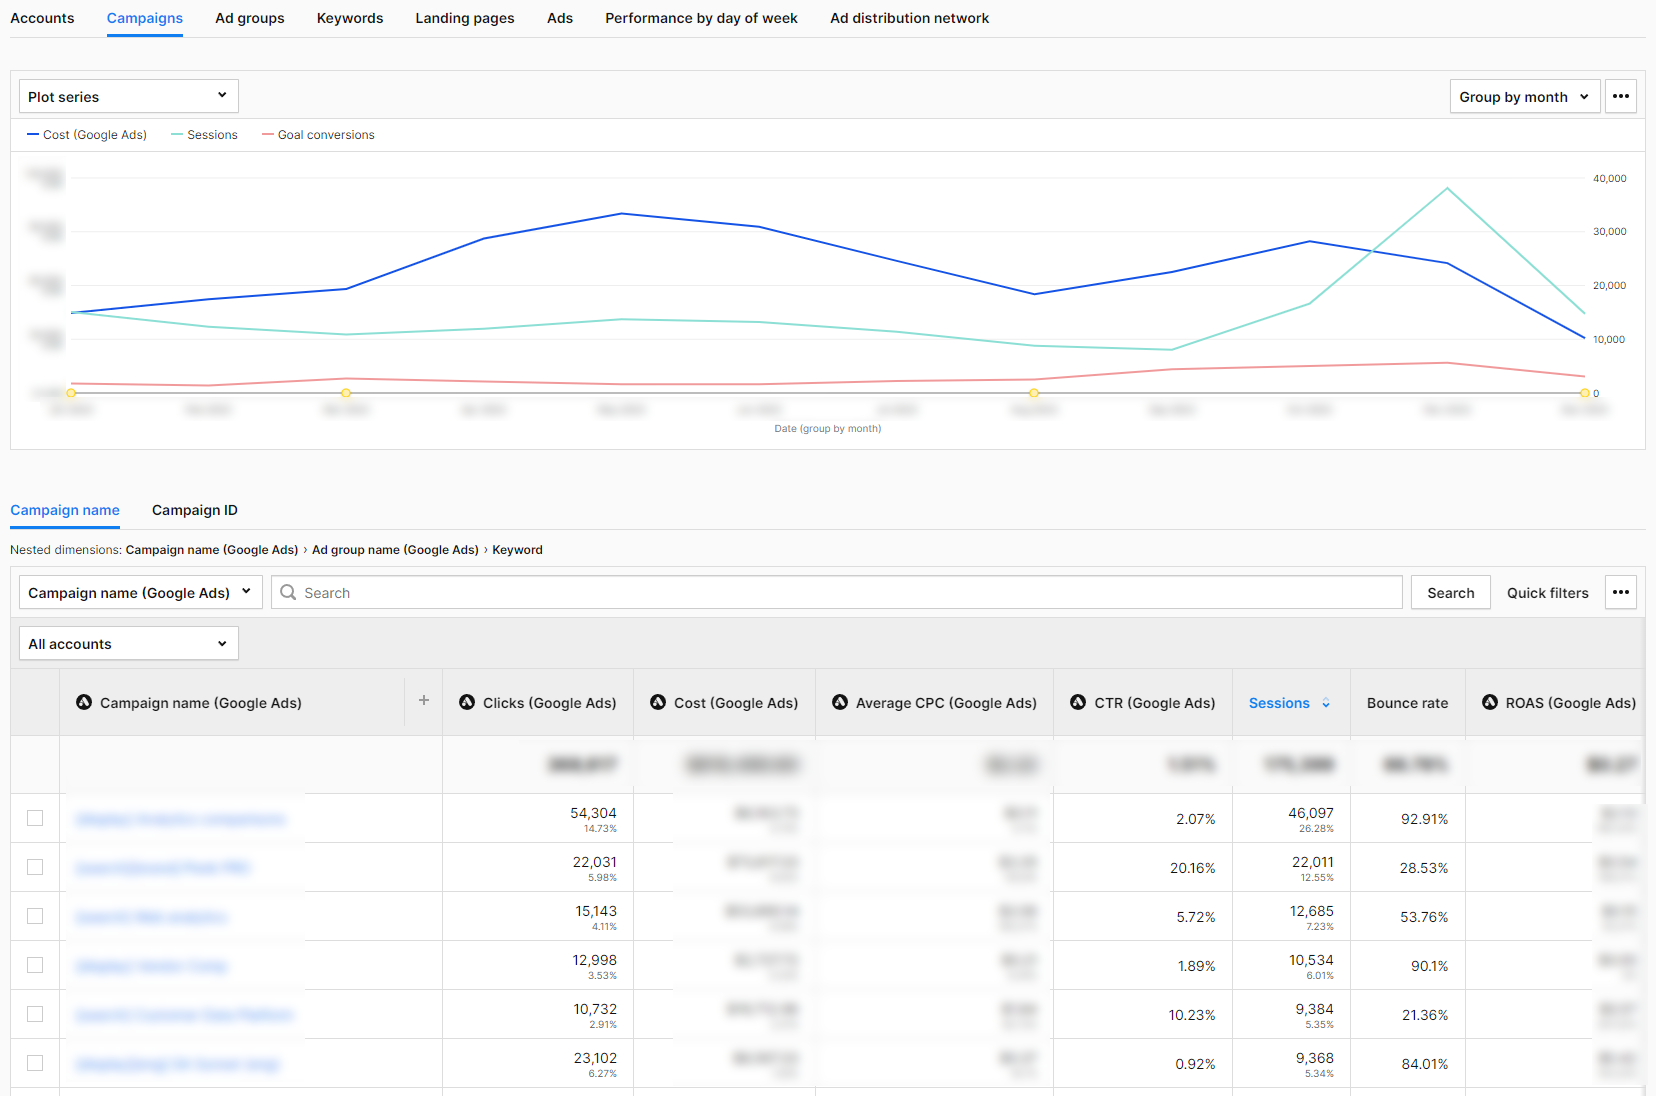
Campaigns
This report shows the performance of campaigns set up in Google Ads that drive traffic to your website.
Here, we analyze campaigns by type, such as display, search, etc. We can also aggregate traffic from one, many, or all campaign types to analyze selected segments.
The report allows you to examine the data clearly and intuitively. The basic view consists of the same metrics as at the account level. Thanks to the analysis of the performance metrics in Google Ads together with those from Piwik PRO Analytics, you can check whether the clicks you got were worth the effort.
The bounce rate provides information on whether users took action after clicking on the ad or simply visited the landing page and left immediately.
Sessions show you which campaigns have prompted your target group to visit your website the most.
If you have set a goal in Piwik PRO Analytics for one or more Google Ads campaigns, you can filter the report by that goal to see if it has been achieved.
Ad groups
This report shows the performance of ad groups in Google Ads that drive traffic to your website. Performance Max campaigns don’t support ad groups, so the data from these campaigns is listed under “no data” in this report.
Keywords
This report shows the performance of the keywords set in Google Ads that drive traffic to your website.
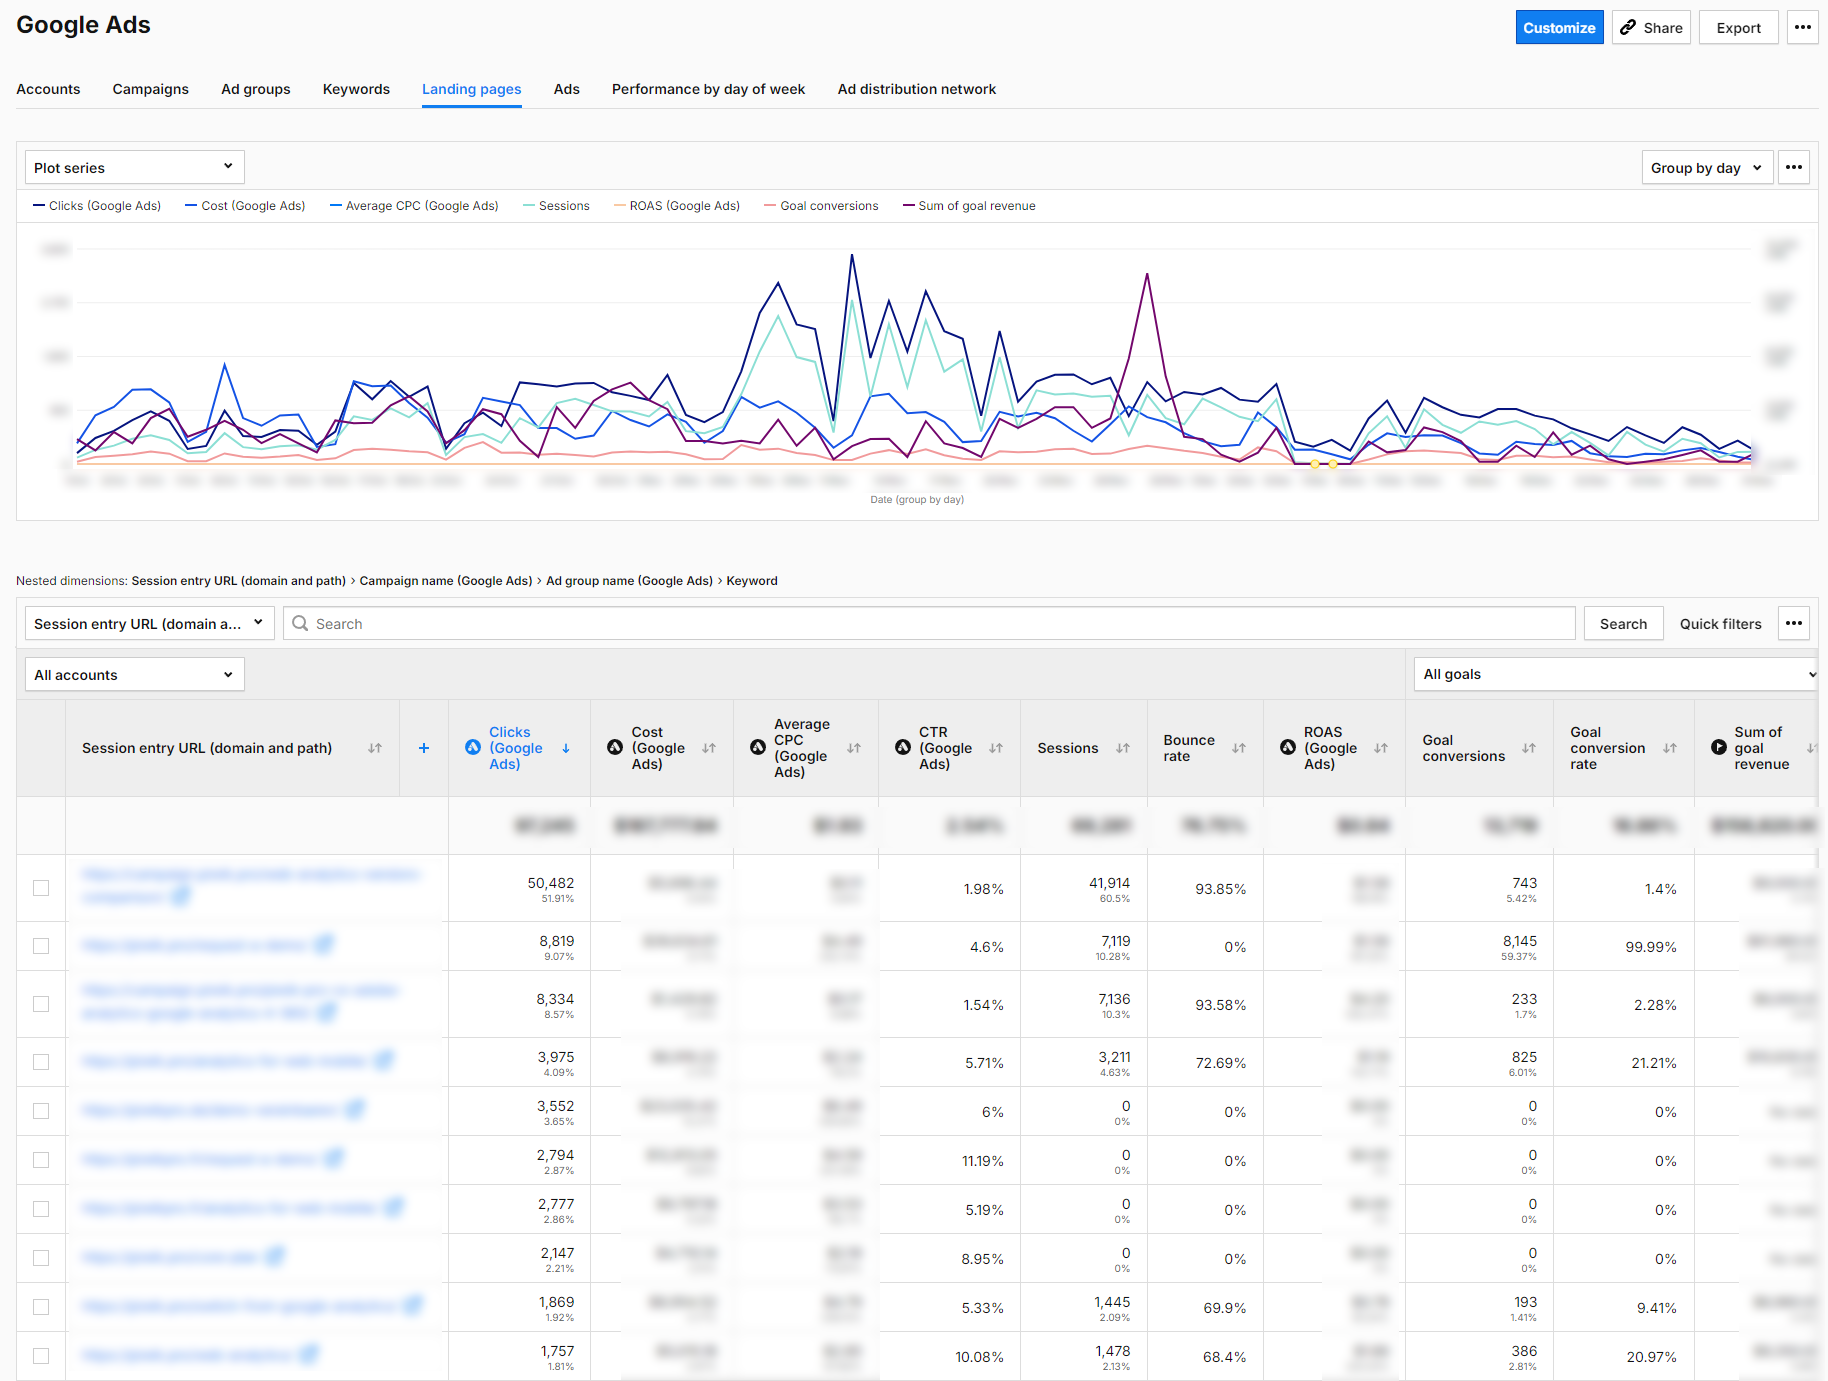
Landing pages
This report shows the performance of landing pages, sorted by the dimension “Session Entry URL”. Like the other reports, it combines metrics from Google Ads and Piwik PRO Analytics Suite. Here, you can see how many conversions you achieved thanks to pages the visitors were redirected to by ads in Google Ads. If the results are below expectations, you can continue the search for possible causes. To do this, examine selected metrics, starting, for example, with the bounce rate, performance on different devices, and page speed.
Ads
This report shows at the ad group level the performance of ads placed in Google Ads that drive traffic to your website.
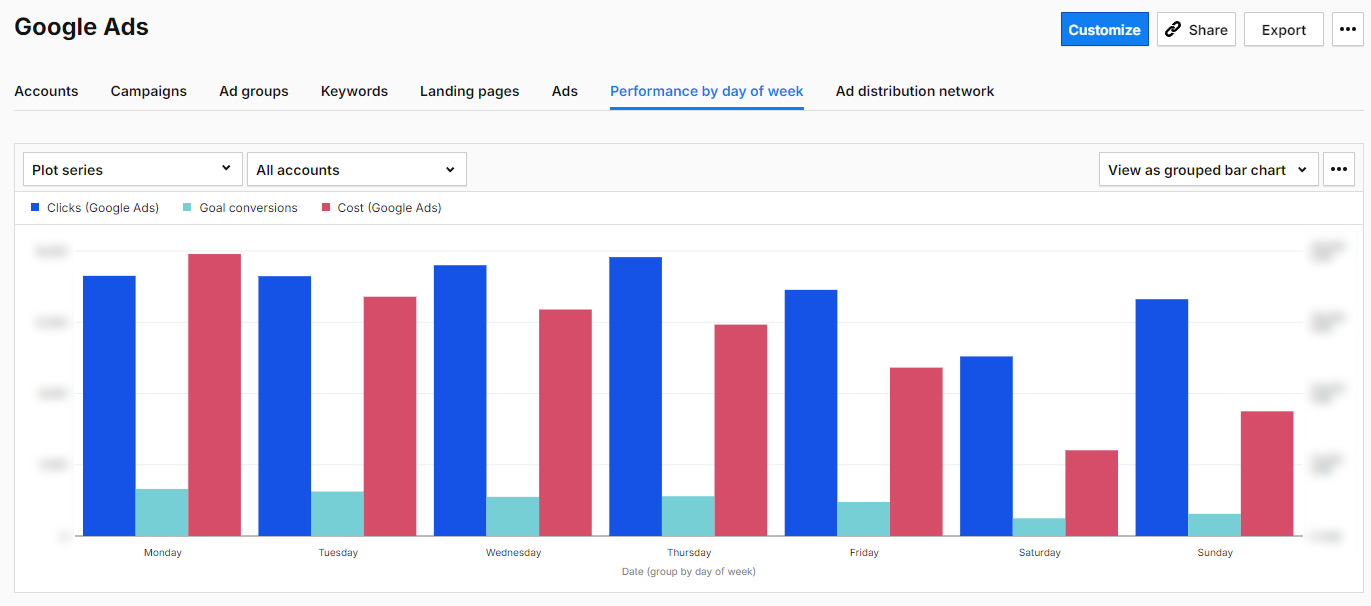
Performance by day of week
This report shows the traffic generated by your ads each day of the week. It combines data on clicks, costs, and target conversions.
Ad distribution network
This report shows where your ad was placed. The networks include Content, Mixed, Search, Search Partners, Unknown, Unspecified, YouTube Search, and YouTube Watch.
Based on this data about your Google Ads campaigns, you can determine which areas require more in-depth analysis. With other features of the Piwik PRO Analytics Suite, you can find out how to optimize your website, ad content, and campaign structure in Google Ads.
Currency conversion
With Piwik PRO’s new Currency Conversions feature, businesses can now consolidate revenue data from multiple currencies into a single standard currency. This ensures accurate financial analysis across diverse markets, enhancing your ability to assess the performance of your Google Ads campaigns globally. Learn more in our article: Currency conversion.
Google Ads optimization with other functions of Piwik PRO Analytics
Landing page optimization
With Piwik PRO, you can identify landing pages that do not fulfill the promise of the ads used in marketing campaigns. This problem manifests itself in various ways. Sometimes, the messaging of the ads and the landing page don’t match. Certain landing pages may perform poorly for certain marketing campaigns. It is also worth checking whether there are marketing campaigns and channels that are directing visitors to the wrong landing pages.
To do so, go to the “Landing Page” tab in the Google Ads basic report. Sort the landing pages in descending order by bounce rate. Look for landing pages with a bounce rate higher than the average bounce rate and a target conversion rate below the average. These are the landing pages you should take a closer look at.
Landing page performance check
In Piwik PRO, go to Behavior—Pages. Enter the URL of the landing page there and check its average loading time.
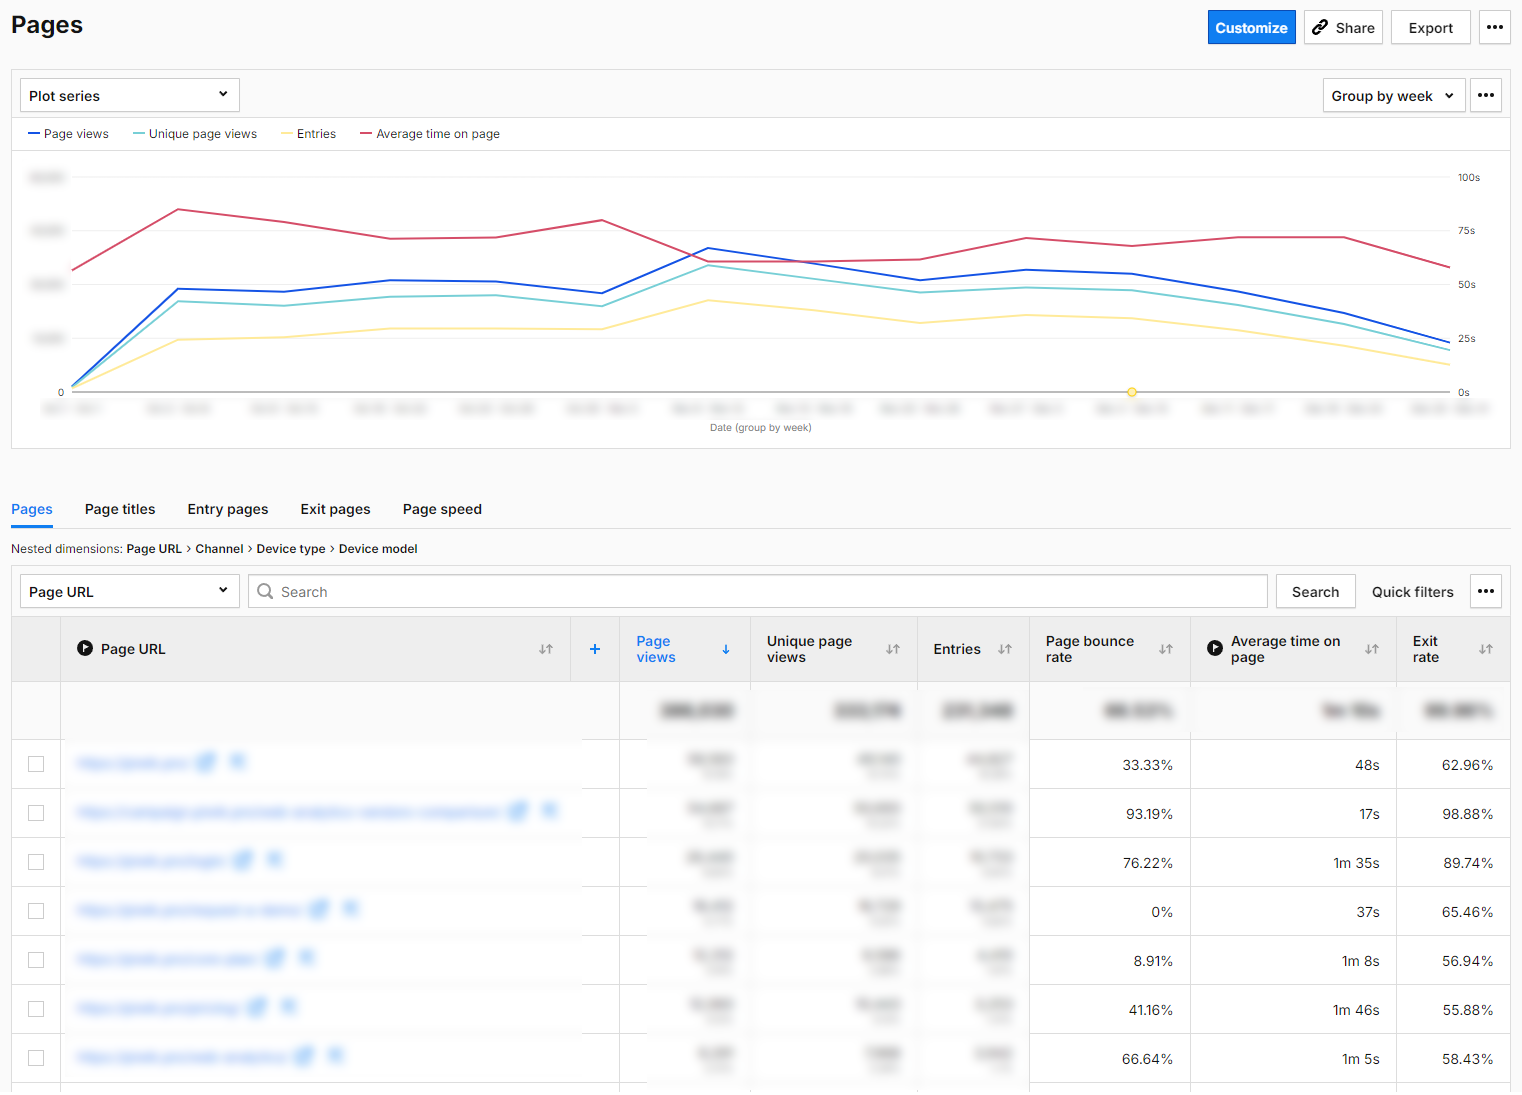
The loading time of your landing page influences your success. If it takes too long to load, your audience could leave the page and never return.
As a result, you spend money on campaigns and, at the same time, rob yourself of the chance of conversions and sales. More importantly, you are also depriving yourself of reliable data for analysis and potentially making the wrong decisions.
For instance, you might think that a landing page’s content or design is flawed, even if it would actually work fine if the loading time was right.
If you notice that your landing page’s loading time is slow, consider optimizing images, CSS, or JavaScript files.
Landing page design check
Is your landing page geared toward conversion? Does it have a clear CTA?
Take some time to analyze the scroll depth of your landing page (you will need a custom report in Piwik PRO to do this). If visitors are not scrolling to the CTA, you are not getting the targeted number of clicks. Check if the page’s content engages the target audience enough to direct visitors to the CTA button. Perhaps you should consider placing the button further up or below the relevant text section.
Run A/B and multivariate tests and optimize headlines, images, texts, and CTA buttons. Thanks to the integration with the most popular A/B testing tools (including AB Tasty, Omniconvert, Optimizely and VWO), you can access your A/B test statistics directly in Piwik PRO.

You can find more information about A/B testing tools here: Best 10 A/B testing tools for 2023: Google Optimize alternatives
Landing page content check
Take another close look at your ad and the landing page. Check whether the message users receive before clicking matches the information they see after clicking. For instance, if you offer free delivery in your ad, but it’s not available on the landing page, or if you promote a particular product but visitors end up on a page displaying various products in that category after clicking.
Experts opinion
Arttu Raittila
Co-founder at Hopkins
Most Google Ads optimization work happens within the platform itself. However, Piwik PRO helps you optimize the bigger picture: budget allocation, landing page experience, and interplay with other marketing channels. Here are some lesser-known ways to go beyond basic features:
Optimize landing page experience with Piwik PRO site inspector for Chrome
Use Piwik PRO’s site inspector for Chrome to analyze heatmaps of your landing pages to improve the user experience and conversions rates.
Do users react to your call-to-actions and other landing page elements as expected? Do they scroll down, or is there a confusing element that stops them?
Analyze longer customer journeys with User IDs
By setting up user ID tracking in Piwik PRO, you can analyze longer customer journeys.
User IDs identify visitors across multiple devices and browsers, overcoming the limitations of expiring cookies. They allow re-identification when users log in or provide contact details.
While this is more straightforward for e-commerce websites, Piwik PRO’s Customer Data Platform (CDP) is also capable of managing complex scenarios.
With a complete view of customer journeys, you can better spot the effects of top-of-funnel advertising like Google Ads display or Demand Gen campaigns. You might also gain insights into the interplay between paid social and paid search.
Paid search rarely works best alone; it benefits from top-of-funnel support. User IDs help uncover these effects, justifying your top-of-funnel spend.
Take things further with Piwik PRO CDP and data warehousing
Piwik PRO’s Customer Data Platform (CDP) enables even more advanced analysis.
With it, you can track longer customer journeys, even for offline sales or those facilitated by salespeople.
Store the collected data in a data warehouse. Once you have enough data, create a model to predict revenue using machine learning algorithms like Random Forest.
This allows you to circumvent the 90-day Google Ads conversion window by using predicted revenue as the conversion value at the point of conversion.
This helps optimize Profit-On-Ad-Spend (POAS), even for products with lengthy buying cycles.
Goal tracking
When analyzing Google Ads campaigns, it is essential to compare Google Ads data (mostly clicks) with traffic quality information (such as goal conversion). By setting goals in Piwik PRO, you can measure micro and macro conversions on your website.
You can easily track your goals automatically by using the information you send to Piwik PRO Analytics:
- Page URL visits
- Page URL title
- Custom events
- File downloads
- Clicks on external links
If you need even more flexibility, you can track your goals manually with the Piwik PRO Tag Manager. This type of goal is tracked when a specific conversion action takes place. Possible scenarios for this type of goal tracking include:
- You have specific goals that cannot be tracked automatically.
- You want to assign revenue to your conversions dynamically.
If you use the advanced settings, you can assign the revenue to your conversion and allow multiple goals per session. The last option is helpful for ecommerce if you want to record all add-to-cart conversions that have taken place in a single user session.
For more information about setting goals in the Piwik PRO Analytics Suite, visit our help center:
By setting up and tracking these goals, you gain valuable insights into the success of your campaigns. At the end of the day, it doesn’t matter how many people clicked on your ad. What matters is whether they take the desired action on your website after clicking the ad.
If you keep your goals in mind, you can analyze these conversions on different levels — campaigns, keywords, and specific creations. It is essential to analyze goals that are similar and have equal weight.
Defining goals also makes it easier for you to segment your website traffic.

If you are still working out the details of your marketing analytics, we recommend the following blog posts:
Custom traffic segmentation
Use segments to divide your visitors into smaller groups and analyze them separately in reports and dashboards. By breaking down your data, you gain insights that would be difficult to discover in a broader analysis.
Here are some basic categories to help you get to know your target groups better:
- Geolocalization at different levels, from continents to regions, countries, and cities.
- Devices that visitors use: desktop, mobile phone, tablet.
- Visitor behavior on the website: whether they are new or regular visitors, how often they have visited the website, and how long their visits lasted.
Compare the visitor groups divided into these categories with the individual dimensions in the basic report on Google Ads or in the Channels and Campaigns reports in Piwik PRO. Then, analyze what results these groups bring you. For example, explore:
- How traffic from mobile devices compares to other channels.
- How the results differ for new and regular visitors.
- Whether a group of visitors who completed a goal (for example, downloaded a file with a report you created) were also interested in other materials (you create a segment for visitors who completed a goal and filter the campaign report by another goal).
- How groups of visitors from different countries fulfilled a specific goal depending on which channel they came from.
This allows you to determine which segments bring you the most clicks, the best target conversion rate, the lowest bounce rate, the highest percentage of new visitors, etc. You can use this information to create a profile of your best target groups. This way, you can more efficiently and effectively determine the target audience for your next Google Ads campaign and your website content.
Find more information on traffic segmentation in our Help Center.
Custom reports
If you have a specific need for information or want to go deeper into data analysis, use custom reports. Custom reports can be created very easily and quickly in Piwik PRO, and details can be found in our help center. These reports can help you with the following:
- Marketing channel efficiency – How your campaigns perform against other website traffic channels, and sources with custom metrics and dimensions appropriate for your business needs.
- Insight into the use and popularity of your landing page in different continents, countries, and cities.
- User flow – How visitors navigate your website after coming across the landing page and whether it is the desired flow.
- Offline conversion tracking.
For more information on how to apply custom reports, click here: How to find website conversion problems with cross-device & cross-browser reports
Google Ads optimization with Piwik PRO Customer Data Platform
Thanks to the new integration of Piwik PRO CDP with Google Ads, you can use the audiences created in the CDP to create personalized and optimized Google Ads campaigns. This integration allows you to leverage your first-party data about how your customers interact with your business at different customer journey stages. You can reach and retarget your customers via Google Search, the Shopping tab, Gmail, YouTube, and Display.
The integration supports two main features:
Customer Match
This feature will make it easier for you to run retargeting campaigns. Let’s say you have a group of users who visit your website, perform specific actions (micro-conversions), or make purchases and have provided you with their identifiable data, such as email address. However, you want to activate them even more.
You can create a list of such users in the Piwik PRO CDP. The CDP’s integration with Google Ads allows you to send this list to Google Ads and target the users with a special ad. The ad will be displayed to them in various places in the Google Ads universe, provided Google identifies the recipient as a listed person.
Let’s say you create a list of your VIP customers in the CDP. To make this segment, select customers who, for example, spend more than x euros per month.
Then, you can directly address your VIP customer group and make them an offer tailored specifically to their needs, with the aim of upselling. Your VIP customers will probably have little interest in your usual ads, which are the same for everyone. But they may respond positively to an exclusive offer. So, instead of bombarding them with everyday ads, send a message offering something unique they can only get from you. By doing so, you approach a one-to-one marketing strategy rather than relying on costly mass marketing.
The Customer Match enables you to:
- Create highly personalized advertising campaigns using detailed customer profiles and behavioral data.
- Target customers more accurately across their entire journey to deliver relevant ads at the relevant stages of the customer lifecycle.
- Optimize your bidding strategies by focusing on keywords and creatives proven to lead to conversions.
- Create target groups that you then exclude from your top-of-the-funnel campaigns (because they contain customers who have already converted, and you only want to target potential customers).
- Create audiences that form the basis for lookalike audiences in Demand Gen campaigns after export from CDP to Google Ads.
Depending on the industry, there are several practical applications for the Customer Match function. Here are a few examples:
Tourism
- Visitors who have looked at offers but not made a reservation: Give them special offers to remind them of the hotels or tours they have looked at.
- Customers who have searched for flights on specific dates: Target them with ads that offer flight deals or travel packages on those dates.
Financial services
- Visitors who have viewed information about a specific financial product: People interested in a mortgage loan, for example, can receive ads with more detailed information or an offer.
- Customers who have used a loan calculator: People interested in calculating loan payments may be interested in certain loan offers.
Education
- Visitors who read course information but have not enrolled: Remind them about the courses and highlight the benefits of enrolling in your ad.
- Participants who have completed an introductory course: Recommend further courses or training to them.
Technology and software
- Users who have downloaded a trial version of the software but have not purchased it: Target them with ads encouraging them to buy the full version of the product.
- Customers using older product versions: Promote the latest product versions or upgrade offers.
Health and wellness
- Visitors who have read articles about specific supplements but have not made a purchase: Offer them promotions or additional information about the supplements they were interested in.
- Customers who have purchased training plans: Offer complementary products such as nutritional supplements or training equipment.
Let’s take a closer look at a typical ecommerce case. We want to see how customers who have abandoned an online purchase can be motivated to complete the transaction.
Use case: Reactivation of shopping cart abandonments with Piwik PRO CDP and Google Ads
Let’s assume you run an online store where the transaction process looks like this:
- The user searches product pages.
- They go to the page of a specific product.
- They like the product and add it to their shopping cart.
- Next, they go to the shopping cart page.
- Once they have confirmed their intention to purchase, they go to the check-out page, fill in their address details, select the shipping method, and enter their credit card details for payment.
- After completing the transaction, the customer is taken to the order confirmation page.
We are interested in users who have placed one or more products in the shopping cart, visited the check-out page, but didn’t complete the transaction and left the website (they never made it to the order confirmation page).
We want to use this target group in a retargeting campaign where a user who placed a product in the shopping cart and then abandoned the transaction sees an ad for this product. When they click on it, they are redirected to the product page.
We start in Google Ads and create a list in Audience Manager called “Website: abandoned cart,” to which we send data from the Piwik PRO CDP.
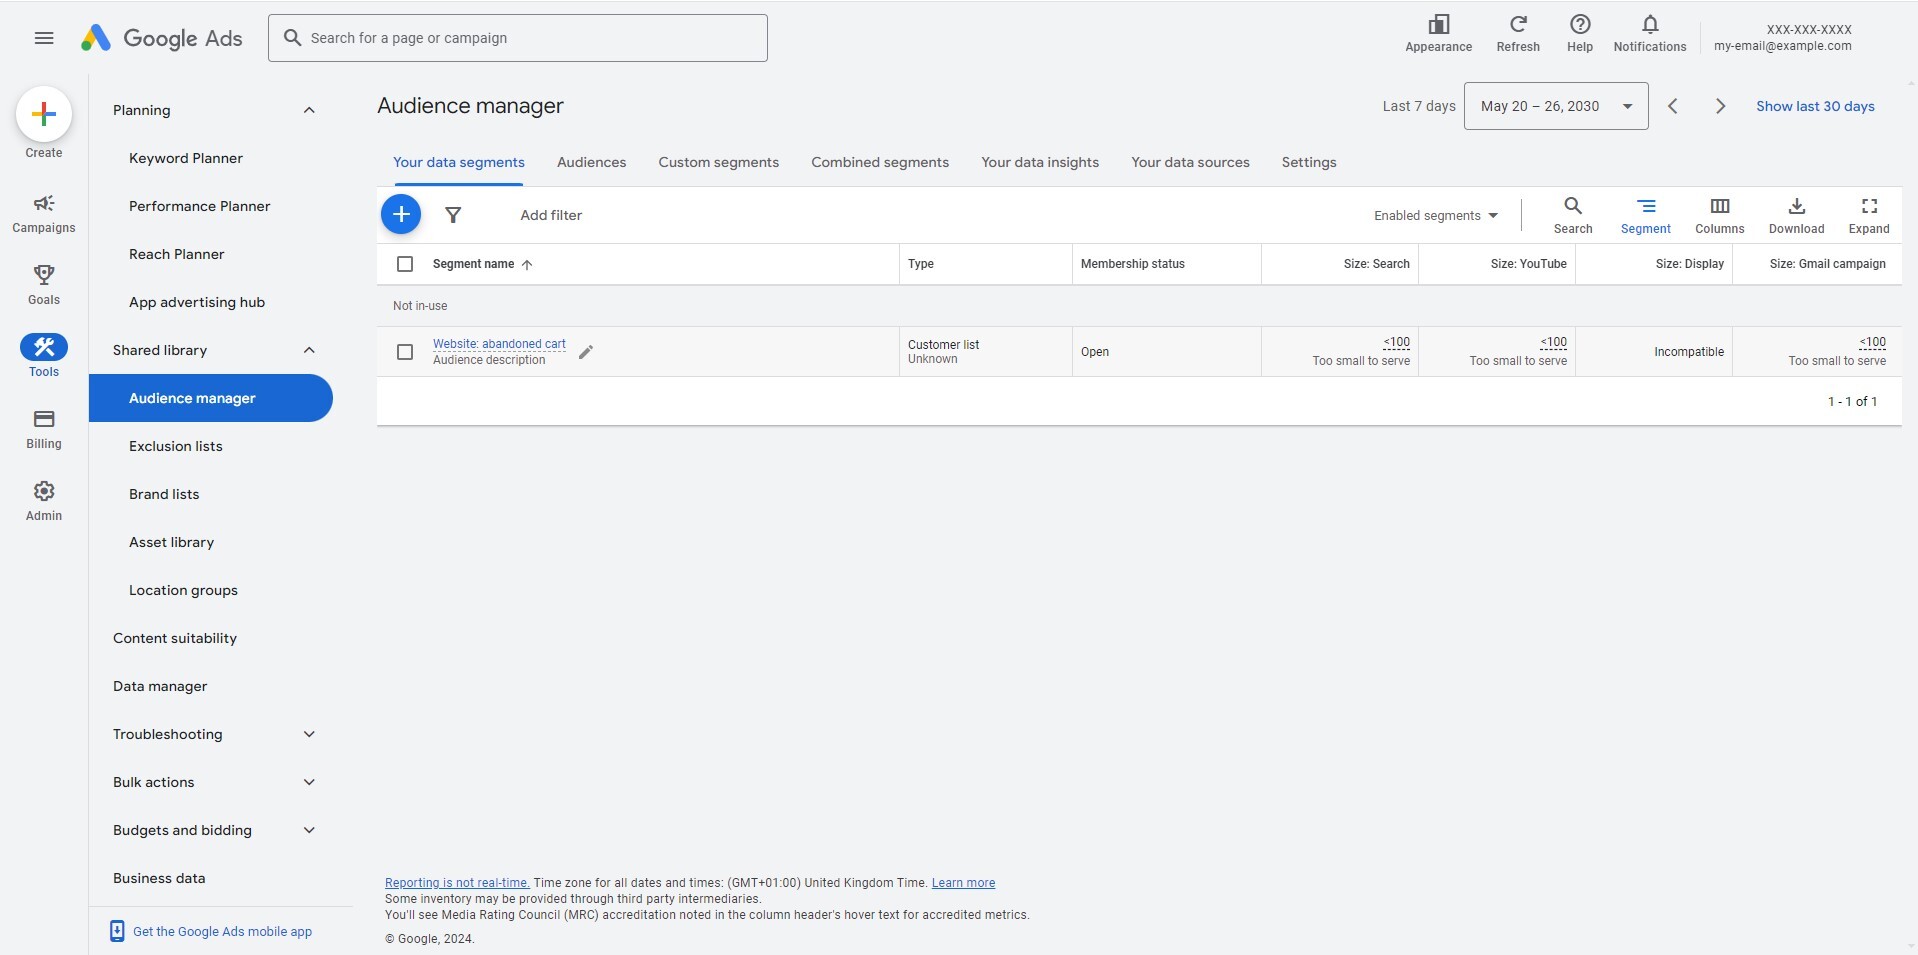
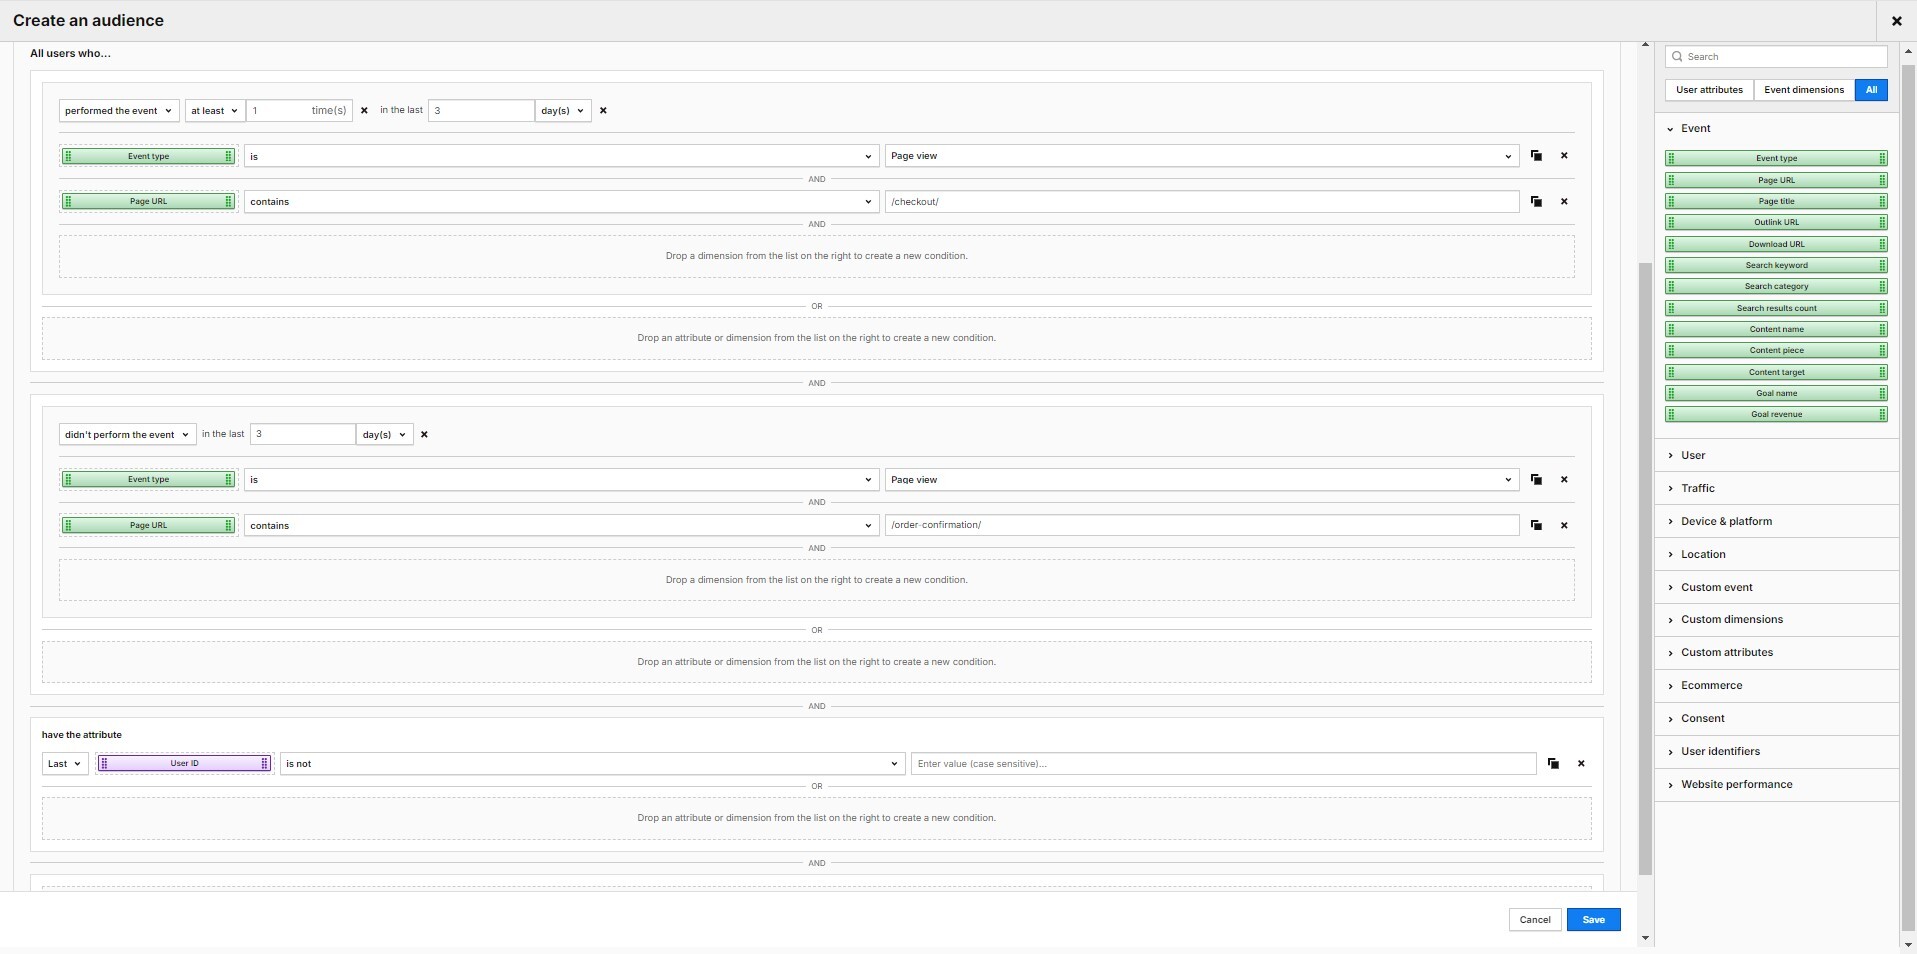
Then we go to the audiences in the Piwik PRO CDP, where we create an audience called “Abandoned shopping cards.” We set the following conditions:
- All users who have performed an event of the type “Page view”, where the page URL contained “/check-out/” – This is because we want to filter in all webshop users who have accessed the page with the check-out form.
- All users who have not performed an event of the type “Page view,” where the page URL contained “/order-confirmation/” – This is to narrow the selection to users who have not completed the transaction.
Now, we switch to the “Activations” tab and activate the previously created target group.
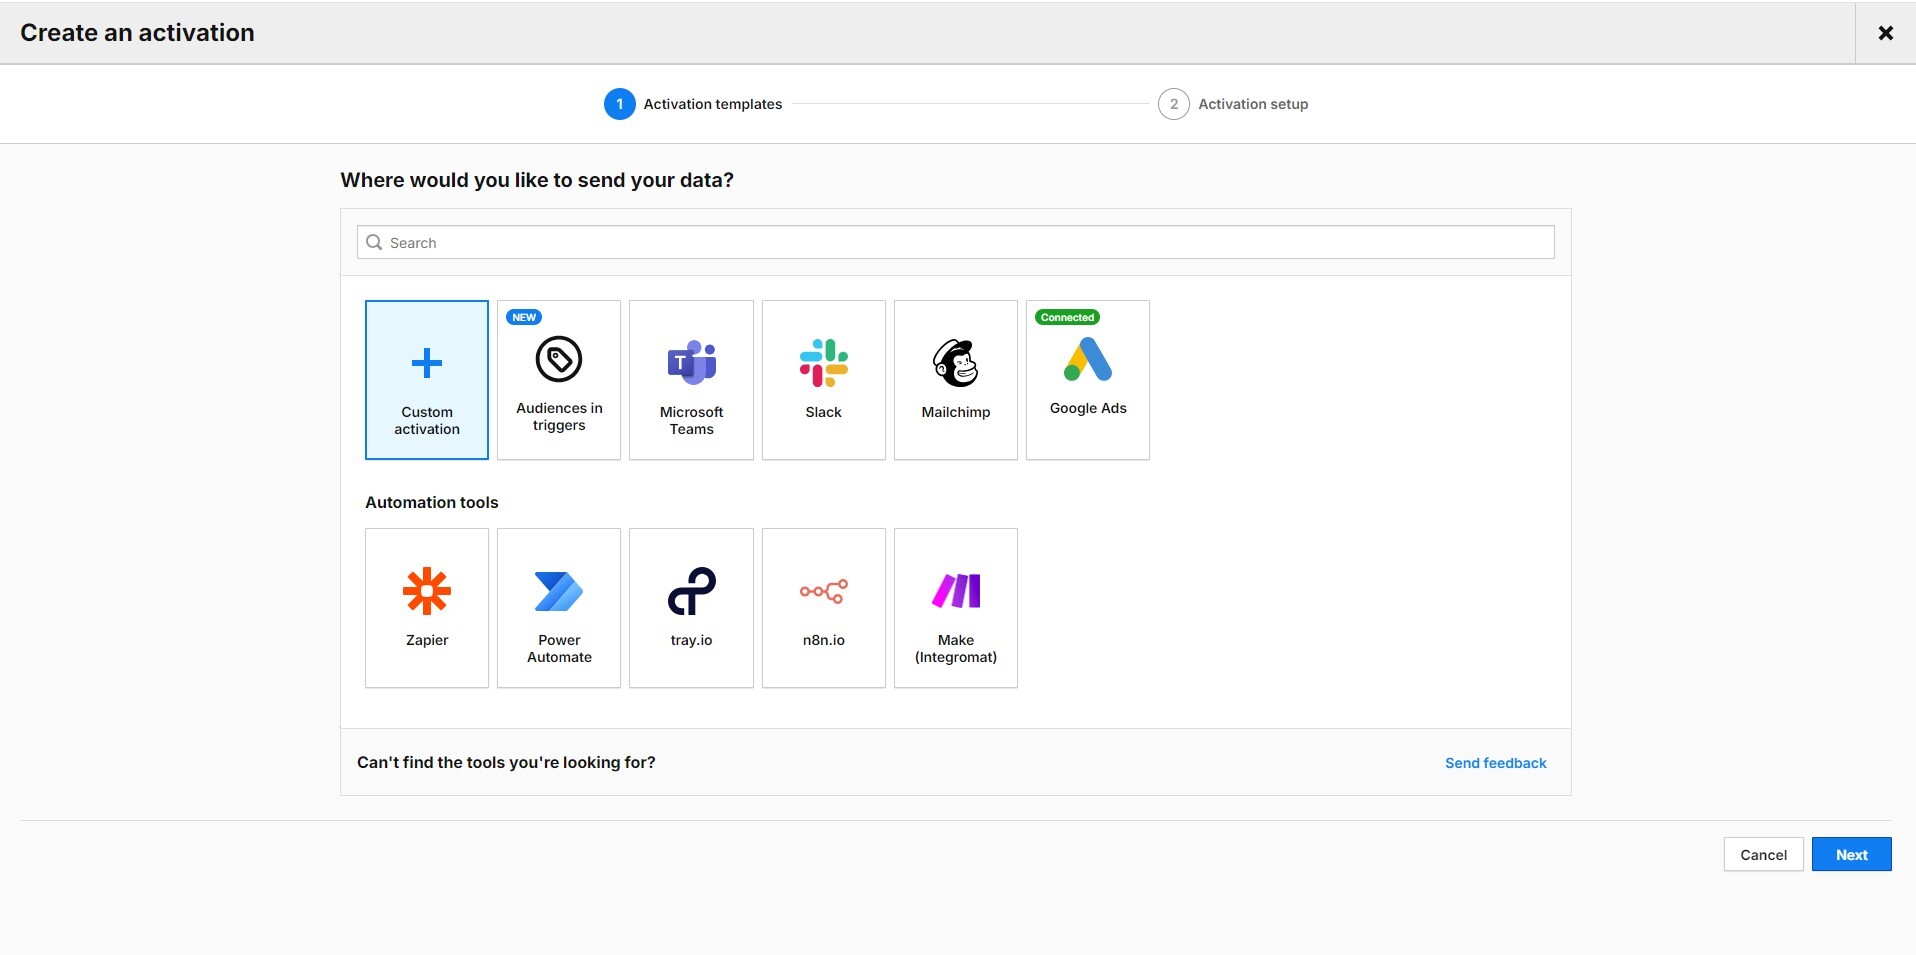
Click on the Google Ads logo and create an activation.
You must first integrate your Google Ads account with Piwik PRO to create an activation. For instructions, please visit our Help Center:
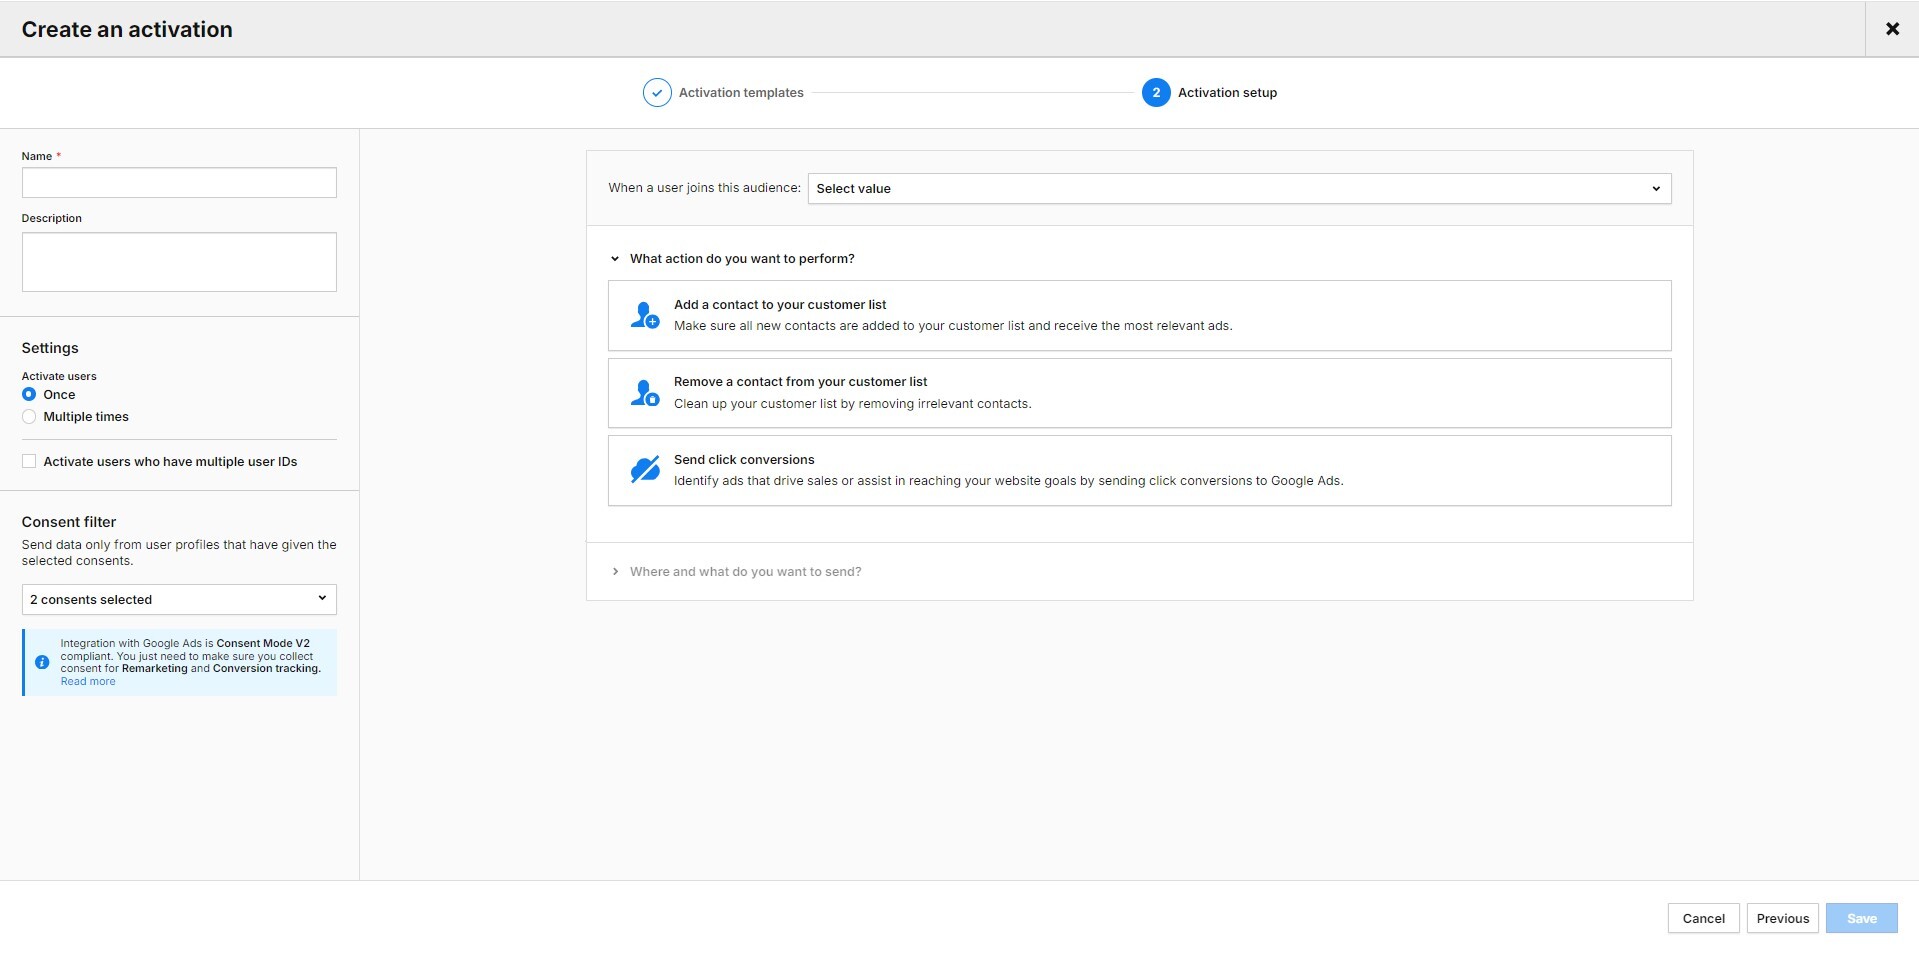
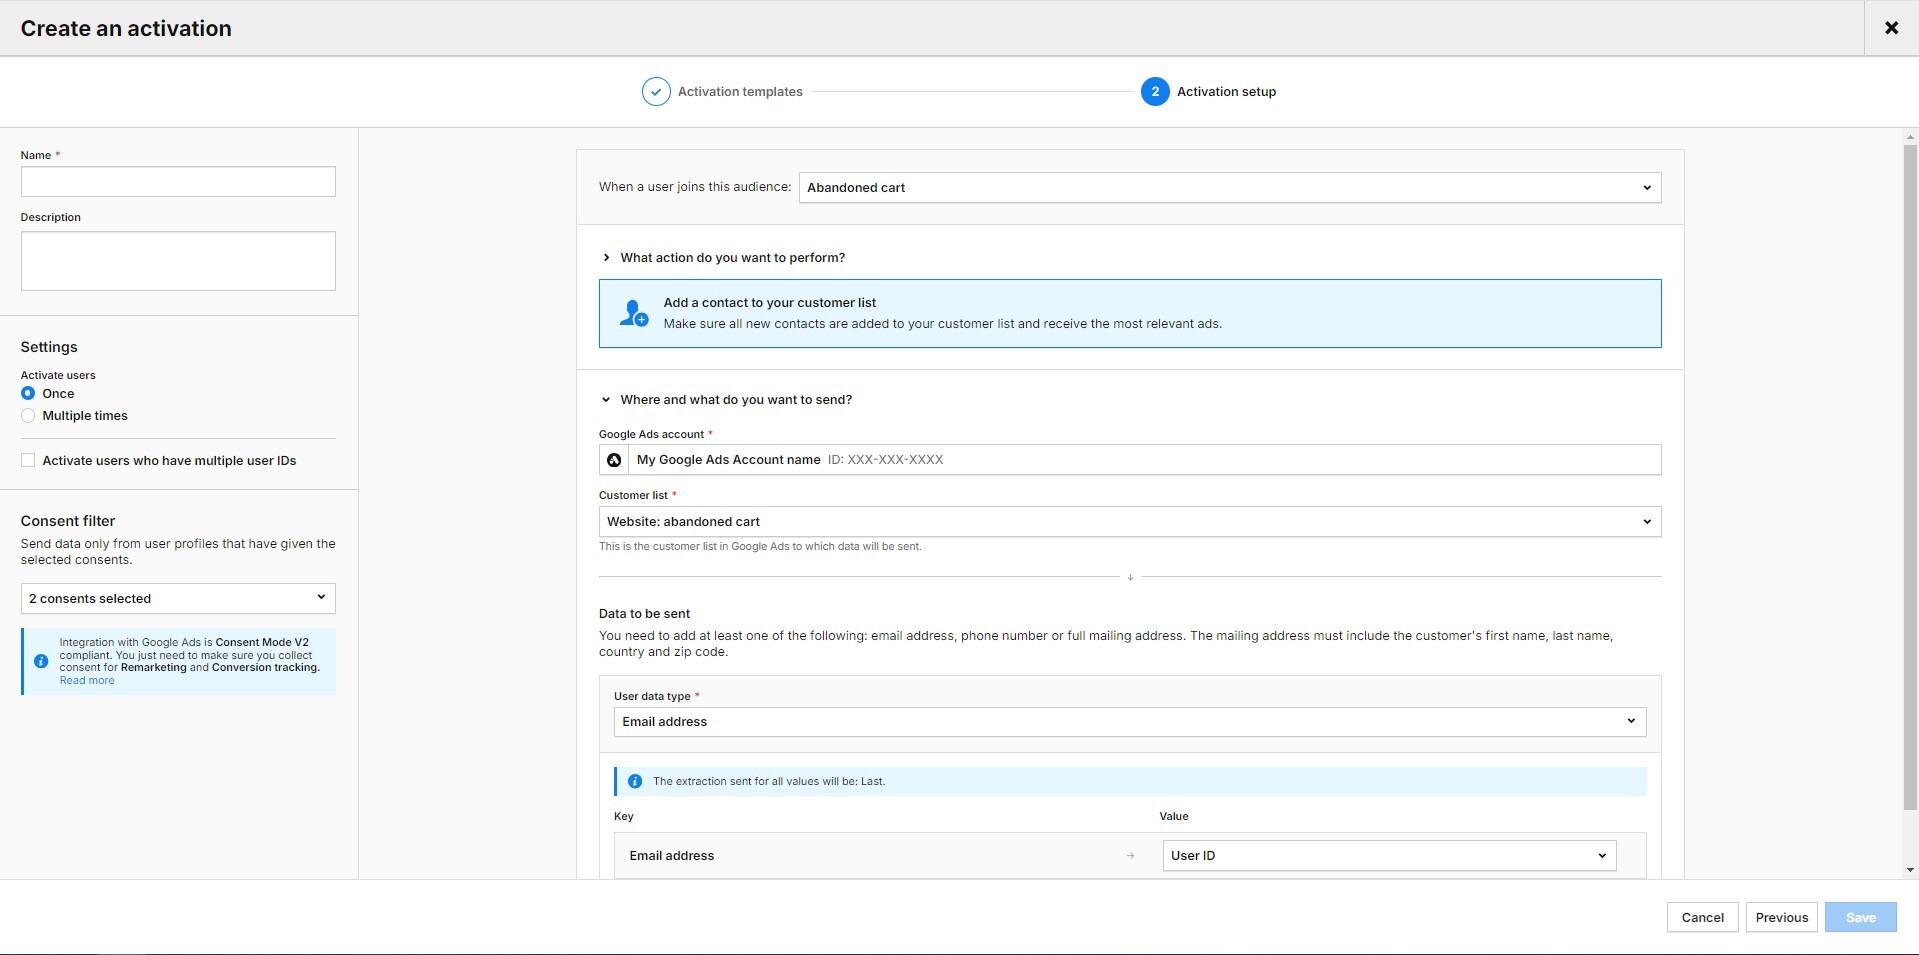
Click on “Add a contact to your customer list.” Select the Google Ads account you want to use for this activation and the name of the customer list (in our case: “Website: abandoned cart”). Next, select the type of data you want to send to Google Ads. You can choose between email address, phone number, postal address, or a combination of these three data types.
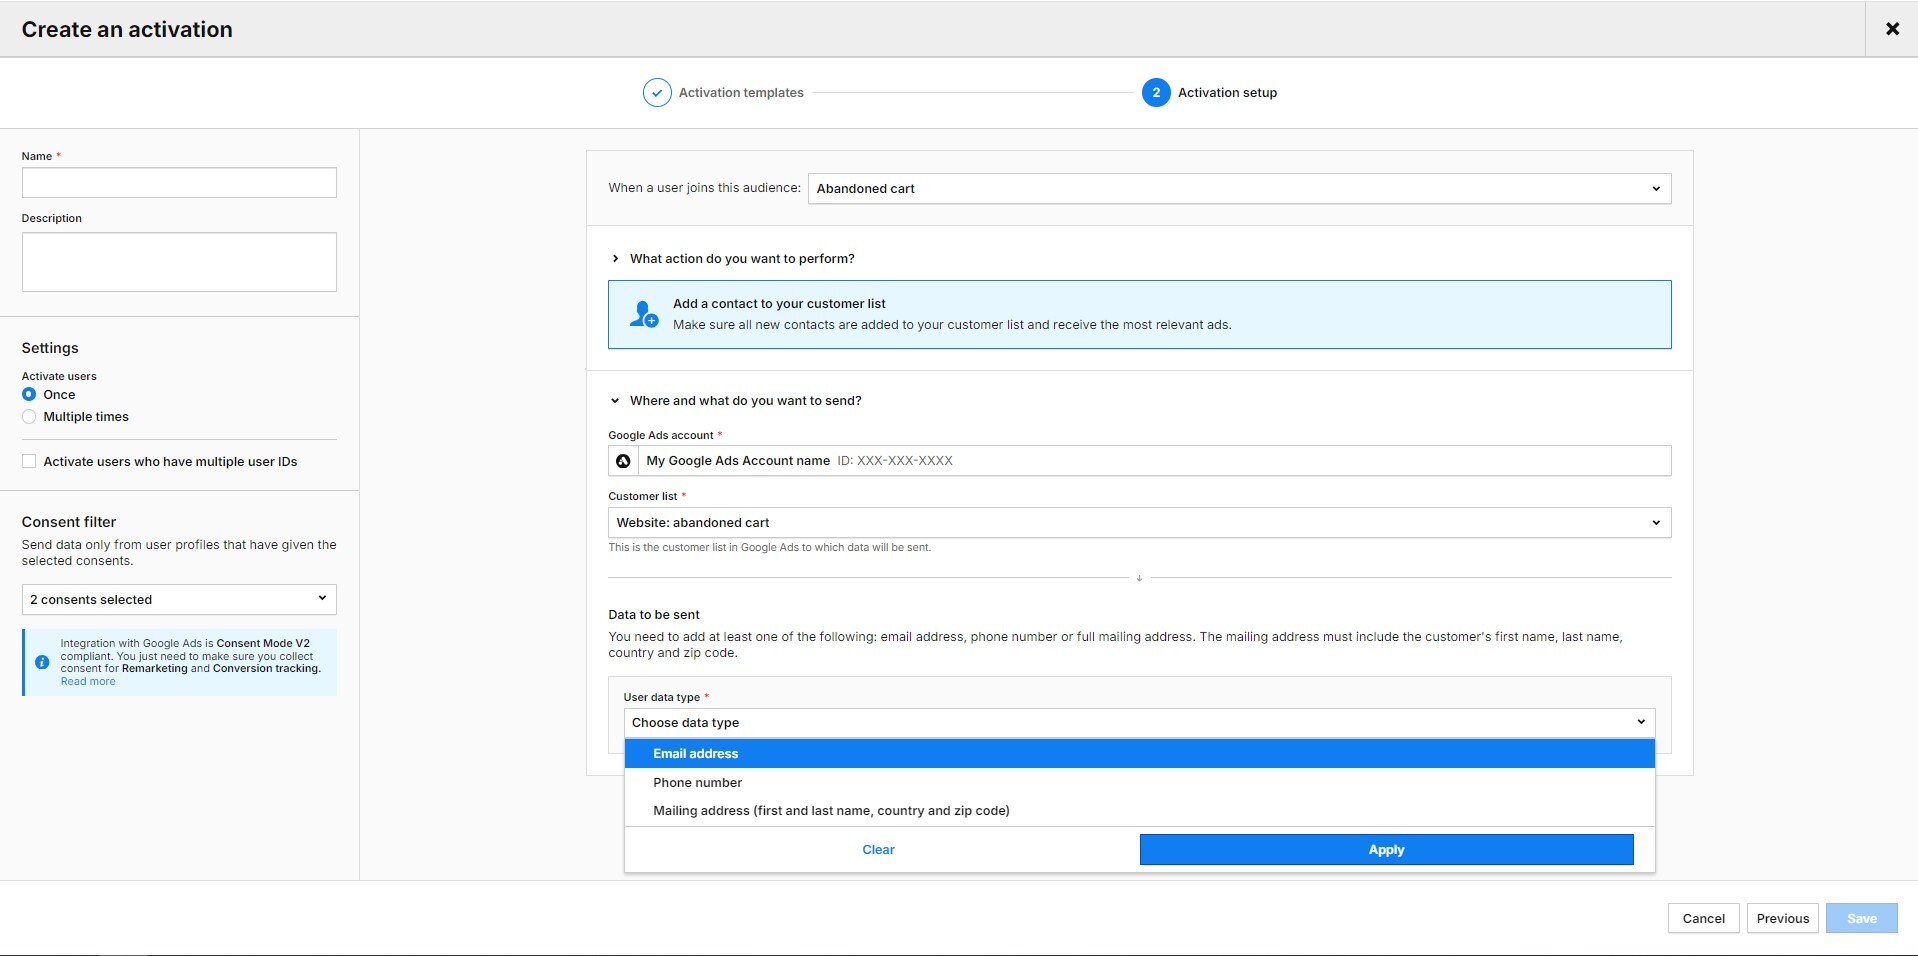
Next, you need to assign a value/attribute to your chosen data types. In our case, we chose the email address and assigned it to the user ID (because, with the correct configuration, if a user fills out a form on the site, their email serves as a User ID in the Piwik PRO CDP).
Finally, give your activation a name, enter it in the field at the top of the left-hand column, and save it.
Your activation is ready. However, you must wait at least 24-48 hours for the first profiles to be displayed in Google Ads.
In the activation log in Piwik PRO, you can see which data was sent to Google Ads, when, and how this platform reacted to it. You can also see whether data is still waiting to be sent, whether there was an error, and whether the export was a success or a partial success. We consider the batch a partial success if some of the data is incorrect, such as incomplete email addresses.

Here you will find more ideas on how to personalize your marketing activities with the CDP:
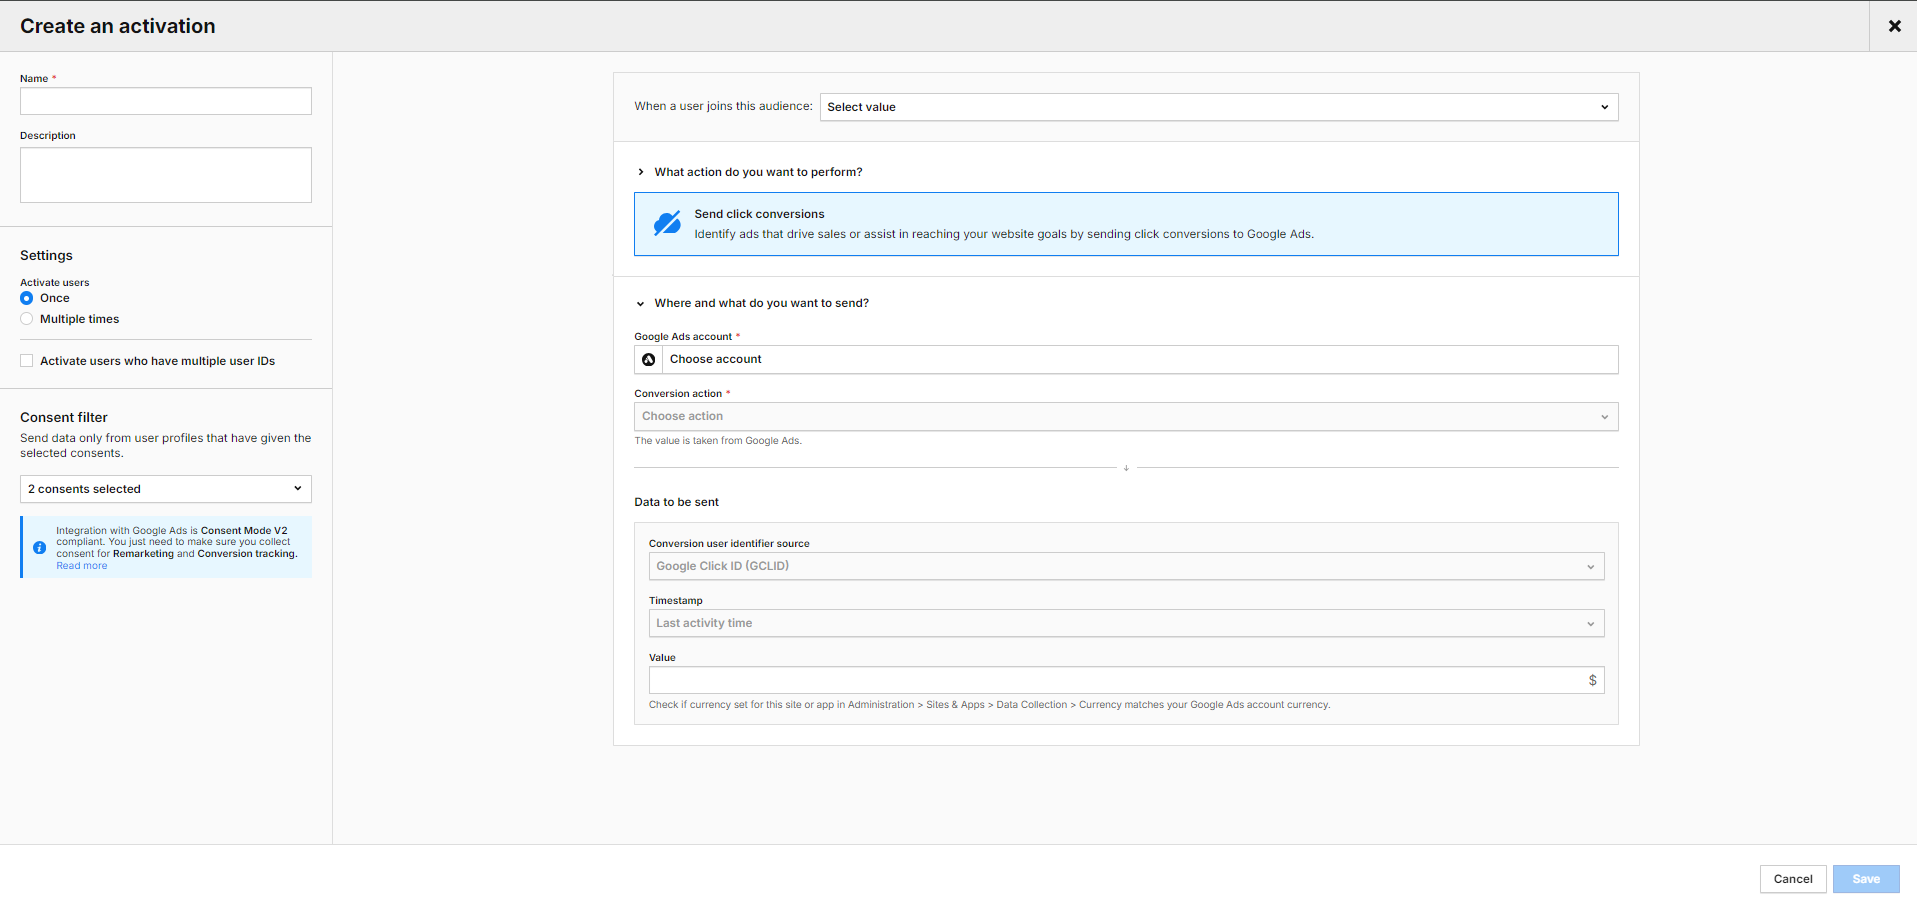
Conversion uploads
In May 2024, Piwik PRO introduced a feature that allows you to automate the import of your conversion tracking information (for example, goals, gclid) to get a more comprehensive view of which keywords and targeting criteria deliver the most cost-effective conversions. By uploading conversions, we teach Google Ads what actions and user groups are most valuable to us. Your data in Google Ads is always up to date, and maintenance costs are minimal.
Conclusion
Achieving a high ROAS in Google Ads campaigns requires continuous monitoring, analysis, and adaptation to current developments. As shown above, the Piwik PRO Analytics Suite can be your ally in this endeavor.
The integration of Google Ads and Piwik PRO gives you detailed insights to refine your campaigns effectively and achieve better results. With Piwik PRO, you can optimize your landing pages, analyze visitor behavior and characteristics in-depth, and personalize your campaigns.
However, the Piwik PRO Analytics Suite offers much more. It is a privacy-friendly platform with advanced analysis capabilities. The suite comprises tightly integrated modules: Analytics, Tag Manager, Consent Manager, and Customer Data Platform. It can also be easily connected to other components of your tech stack.
The high data protection standards are complemented by flexible hosting in the cloud and in the private cloud, including data centers operated in the EU.
See pricing of our plans or get a custom demo of the Enterprise plan.
The post How to optimize Google Ads campaigns with Piwik PRO Analytics Suite appeared first on Piwik PRO.
]]>A thorough grasp of the large data volumes generated by customer activity in your ecommerce operations is critical to determining what works for customers and what doesn’t.
The post What is ecommerce analytics and how can you use it to grow your business appeared first on Piwik PRO.
]]>SUMMARY
- Ecommerce analytics focuses on collecting and analyzing data from online stores to inform business decisions, track customer journeys, and optimize marketing strategies.
- Businesses are able to track data and gain detailed insights into their store and customers, such as audience demographics, acquisition channels, customer behavior, and product performance.
- Data activation is essential for maximizing the benefits of ecommerce analytics, leading to improved user experience and more sales.
- To benefit from their data, businesses must, among others, take a holistic approach to their customer journeys, define their KPIs, integrate data sources, and adjust data for seasonality and trends.
The global ecommerce market is expected to be worth $6.3 trillion in 2024 – up from $5.8 trillion in 2023. This continuous growth makes ecommerce one of the most competitive industries. The heightened competitiveness has pushed businesses to find ways to gain an edge over their competitors. The best option they have is turning to what’s readily at hand – vast amounts of data shared by customers.
A thorough grasp of the large data volumes generated by customer activity in your ecommerce operations is critical to determining what works for customers and what doesn’t. This is especially important given that the average cart abandonment rate for online shopping exceeds 70%, presenting both a massive challenge and opportunity to ecommerce strategies.
Ecommerce analytics empowers you to better understand your customers’ actions and increase profits. The key is to collect the right data, draw granular insights about your audiences, and put those insights to work. With this powerful tool at your disposal, you have the control and capability to steer your business towards success.
Today, we will discuss using ecommerce analytics to create more effective campaigns, increase sales, and strengthen your brand’s position.
What is ecommerce analytics
Ecommerce analytics involves collecting and analyzing data from an online store to inform business decisions. This process consists of tracking different aspects of the customer journey, including discovery, acquisition, conversion, retention, and advocacy.
These metrics relate to sales, customer behavior, and site performance, providing insights to optimize marketing strategies, improve customer experience, and increase revenue. By gathering and analyzing data from multiple sources, ecommerce businesses can understand their store’s performance and identify the business aspects they should optimize.
Unlock the power of your Shopify store with Piwik PRO
Drive smarter decisions with Piwik PRO’s Shopify app. Track customer behavior, product interactions, and sales performance with ease, without the hassle.
The app simplifies setup, ensures GDPR-compliant data collection, and integrates seamlessly with your Shopify store. Gain valuable insights that help you optimize your ecommerce business and stay ahead of the competition.
Why is ecommerce analytics important
Ecommerce analytics gives businesses the tools to apply business-specific insights to their processes and keep growing in the highly competitive and continually evolving ecommerce industry.
They can use the collected data insights to:
- Understand which channels bring the most customers and optimize their marketing budget and investments accordingly.
- Learn which customer groups spend the most money and what they typically purchase, and target them with custom offers.
- Discover which customers are least likely to make a second purchase and why, and develop an appropriate customer retention strategy.
What types of data can you analyze through ecommerce analytics
Ecommerce analytics allows you to gain insight into different aspects of your business:
Audience
Data about your audience helps you understand your target group’s demographics and interests. You can connect this information with your customers’ behaviors and tailor your offers to their needs, making them feel valued and understood.
Your audience data may consist of the following information:
- Income
- Occupation
- Geographic location
- Languages spoken
- Device
You can use this data to:
- Fine-tune your customer persona and determine the pain points you need to address.
- Plan and adjust your shipping options and ads based on your audience’s locations.
- Offer product recommendations based on your audience’s device type.
Audience reports in Piwik PRO are divided into a few sections:
- Overview: A summary of audience metrics, including the total number of orders, overall revenue generated, and the value of abandoned carts.
- Session log: Details of individual shopper sessions, including duration, page views, and actions taken.
- Devices: Categorizes the audience based on the devices they use to access your online store.
- Countries: Insights into the geographic distribution of the audience, helping you understand your international reach.
Acquisition
Acquisition data informs you about the sources and channels that bring traffic to your online store and result in conversions. You can learn how visitors discover your business, which lets you improve your marketing strategy and attract more potential buyers.
Here are some customer acquisition metrics to keep in mind:
When using acquisition data, you can discover which marketing channels drive the most traffic and lead to the highest conversions and sales. You can see which online marketing channels are the most effective and which aren’t working. This data is crucial in understanding where to focus your resources and what future campaigns to plan.
Acquisition reports in Piwik PRO are divided into a few sections:
- Channels: Insights into the various sources and channels that drive traffic to your online store.
- Landing pages: The performance of different landing pages, including conversion rates and engagement metrics.
- Campaigns: The effectiveness of marketing campaigns in terms of click-through rates, conversion rates, and ROI.
- Attribution: The impact of each marketing channel or campaign in driving conversions.
Behavior
Insights on customer behavior open up a world of opportunities. They let you deep-dive into shoppers’ actions and interactions in your online store, shedding light on shopping stages, product preferences, and loyalty. You can measure and analyze purchase data to learn when and how your audience members tend to convert. Behavior analytics also helps you discover how to improve user experience to boost engagement and conversion rates.
Some metrics you can track here include:
- Sales conversion rate
- Average order value (AOV)
- Cart abandonment rate
- Revenue
- Cost per conversion
- Return on ad spend
Here are some questions you can ask to get an idea of your customers’ behavior:
- When do visitors tend to drop off from their journeys?
- How many viewers leave your website straight away?
- What pages do people visit first after landing on your site?
- What marketing content do users consume the most?
- Which products get a lot of traffic but few sales?
- Which products bring the most revenue?
- How long does a typical shopper take before they make a purchase?
- How often does each shopper buy from your store?
- How many customers abandon their shopping carts?
Behavior reports in Piwik PRO are divided into a few sections:
- Shopping behavior: A funnel-based report that helps analyze the customer journey from product discovery to purchase and spot drop-off points.
- Shopping stages: Depicts shopper behavior throughout the shopping process, identifying potential areas for improvement.
- Days and Sessions to Order: The time and engagement required for customers to complete a purchase, providing insights for optimizing the conversion journey.
- Orders: Detailed order data, including revenue, tax, shipping, discounts and product quantity, to identify trends in customer purchasing behavior.
- Products: Insights into the performance of specific products, such as orders, revenue, click-to-detail rate and order-to-detail rate, guiding product optimization and marketing strategies.
- Customer loyalty: Metrics such as days since last order, order value, and product quantity to identify loyal customers and develop strategies to enhance their long-term value.
Ecommerce features in Piwik PRO
In 2023, we launched a new ecommerce setup with several enhancements to improve your online store’s reporting.
Apart from dedicated ecommerce reports, your store can benefit from other useful features:
Product scope
Product scope is available in all reports, including custom reports, web APIs, and raw data, in addition to the session and event scopes. Product scope lets you use dimensions and metrics related to products to give you more precise reporting and a deeper understanding of your product performance.
New dimensions and metrics
You can benefit from several new dimensions and metrics that will help you better analyze your online store data. For example:
- Product detail views show how many times shoppers viewed the product detail page.
- Cart-to-detail rate shows how product details affect cart additions.
- Order-to-detail rate shows how product details affect product sales.
Introducing Currency Conversions: Unified revenue data for smarter global analytics with Piwik PRO! Learn more from our article.
Sample use case for order-to-detail rate
The order-to-detail rate is calculated as Orders / Product detail views * 100%.
You can compare it for various products based on their details.
If the rate is low, meaning there are many product detail views but few orders, you may need to improve the product images, adjust the description, or make other changes.
Or, you may see that the rate is higher for a specific product color, suggesting that you make that product version the principal one.
See the complete list of ecommerce dimensions and metrics.
How can your business benefit from ecommerce analytics
Ecommerce analytics will show you trends and patterns in data, allowing you to:
- Understand your customers’ interests and product preferences – With this knowledge, you’re able to optimally position your products and support customers’ purchasing journeys. It also lets you optimize your inventory and influence your marketing efforts.
- Optimize pricing and inventory – You get a granular picture of what drives pricing for every consumer segment. Use this insight to discover the best price points at the product level rather than category level and gradually increase revenue.
- Measure the effectiveness of marketing campaigns – You can gain detailed insight into your marketing performance across channels. This lets you monitor all your campaigns and react quickly to adjust your activities if needed.
- Improve customer retention and loyalty – You can analyze customers’ past behaviors and purchases to better understand their interests and the choices they make when they buy your products.
Experts opinion
David Culbertson
CEO at LightBulb Interactive
I deal with small businesses, several of whom have Shopify-based ecommerce websites. While Shopify offers a decent analytics toolkit, it’s very limited compared to a robust analytics solution with a wide variety of metrics; it’s like looking at a website through a keyhole.
When choosing an analytics solution, my clients face many challenges, including:
- Price sensitivity (they’re used to free).
- Lack of expertise to interpret reports.
- Concerns about data accuracy.
In a crowded marketplace, finding the analytics solution that can address those challenges can be bewildering. Luckily, I’ve been able to guide my clients to Piwik PRO which solves many issues and gives them peace of mind.
How to analyze and improve the performance of your ecommerce store
The details of what data you collect and analyze will largely depend on your business goals and the specifics of your company.
Below, we present a sample process for gathering insights that would become a foundation for more in-depth analyses.
Acquisition
The acquisition report gives you a base for exploring your data by providing an overview of channel and campaign performance. It will help you understand how users find your website and how they behave.
Here are some questions you can try to answer while looking at the data:
- What is the split between different traffic sources?
- Which sources bring in the most traffic?
- What keywords do people use to find your website?
pro tip
You can dive deeper into user behavior on your website and consider the following aspects:
- What’s the first thing people tend to do after landing on your website?
- What are the typical paths that users take from the homepage to other pages?
- How long do users spend on the website? An average engagement time of one to three minutes may indicate their intent to explore the page further or make a purchase.
- What is the ratio of new vs. returning visitors? If you’re not retaining many visitors, you need to find out what’s stopping them from coming back.
- What category, product or other types of pages do users visit the most and how do they interact with them? This can help you identify the most engaging pages and understand where the purchasing process begins.
Channels
You can now see in more detail how people from different channels behave and go through the shopping process.
For each channel, analyze metrics like:
- Bounce rate
- Cart abandonment rate
- Total revenue
- Average order value (AOV)
- Product detail views
- Cart-to-detail rate
- Order-to-detail rate
pro tip
Aside from analyzing these key metrics, consider the following questions:
- How do purchases typically happen? When and on which pages do people tend to make a purchase?
- What is the ratio of orders by new vs. returning visitors? Check this data for different countries or regions, especially when evaluating ad campaigns.
- What products are the bestsellers?
- How often do customers take advantage of discounts or promo codes? You might miss out on revenue opportunities if they use discounts too frequently.
- How often do transactions happen? How many days typically pass between orders?
With this analysis, you can determine which channels bring the most revenue and which are underperforming. You may discover channels with hidden potential, giving you an idea of the types of campaigns you should invest in more.
For example, you may find that email brings the highest average order value despite having the lowest number of visitors. Consider allocating more resources to email campaigns or broadening your email audience.
Landing pages
Another aspect is landing page performance.
For each landing page, analyze the following metrics:
- Number of page entries
- Bounce rate
- Order rate
- Cart abandonment rate
- The sum of revenue
- Average order value (AOV)
For example, you may find a product landing page with many entries that has a high bounce rate, low order rate, and low revenue.
To investigate the possible causes, determine which channels bring the most traffic to this page. If it’s paid campaigns, review the different aspects of ad configuration and assets you should adjust – such as product descriptions, images, alignment between the ad and the landing page, and so on.
Paid campaigns
Next, evaluate the performance of paid campaigns to assess whether the revenue is higher than the ad spend.
For each campaign, check metrics such as:
- Cost
- The sum of revenue
- Average revenue
- Return on ad spend (ROAS)
Product categories
Additionally, you can find out which channels drive traffic to specific product categories.
For each product category, check:
- Channels
- Sessions
- The sum of product revenue
The complete Piwik PRO Shopify app playbook
Tap into advanced analytics and a built-in customer data platform (CDP) to improve your Shopify store’s performance. This playbook offers actionable strategies, real-world examples, and step-by-step instructions to help you grow your business while staying compliant with global privacy laws.
Shopping behavior
The next step involves analyzing customer journeys on your website.
For example, in Piwik PRO, you could create a funnel to get an overall picture of the shopping behavior:
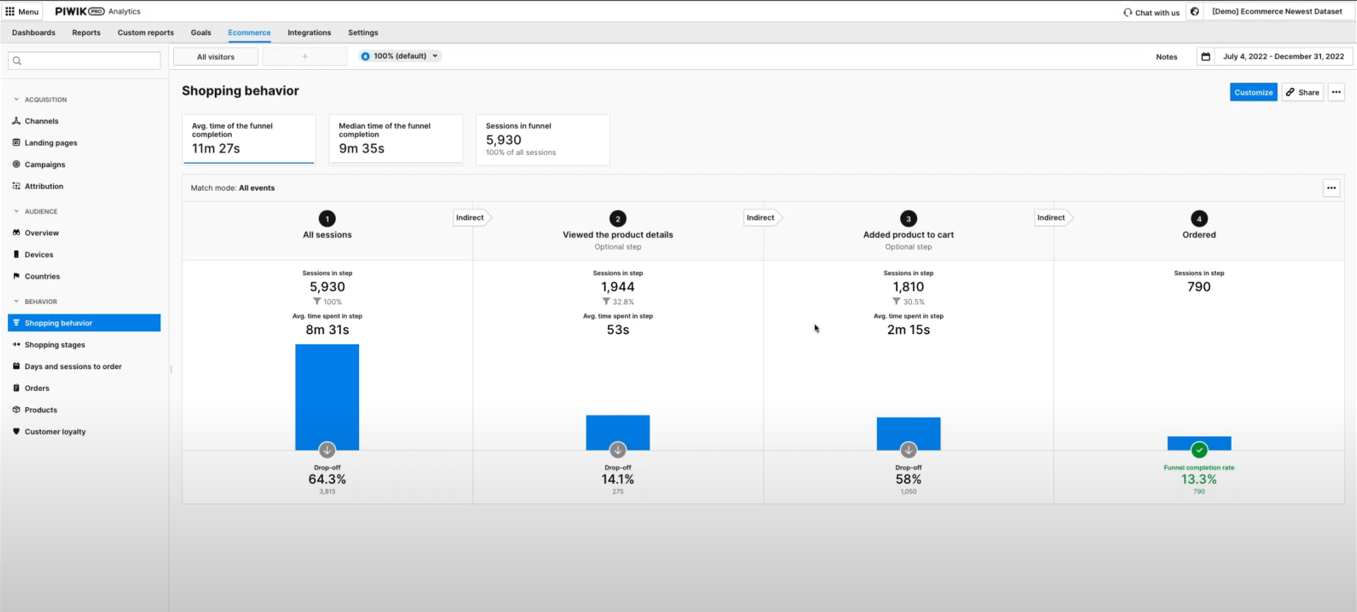
Focus on analyzing the number of users who drop off at each step. To benchmark, you can compare the current numbers with results from the previous period.
For example, you may discover that many people leave after adding a product to their cart. You should then investigate the reasons for the increased cart abandonments.
For that purpose, evaluate the pages users visit before abandoning their carts. If they abandon their carts while on the checkout page, it may indicate the page is difficult to navigate or lacks usability.
You can dig deeper into the checkout process by analyzing a sample funnel report showing the checkout steps:
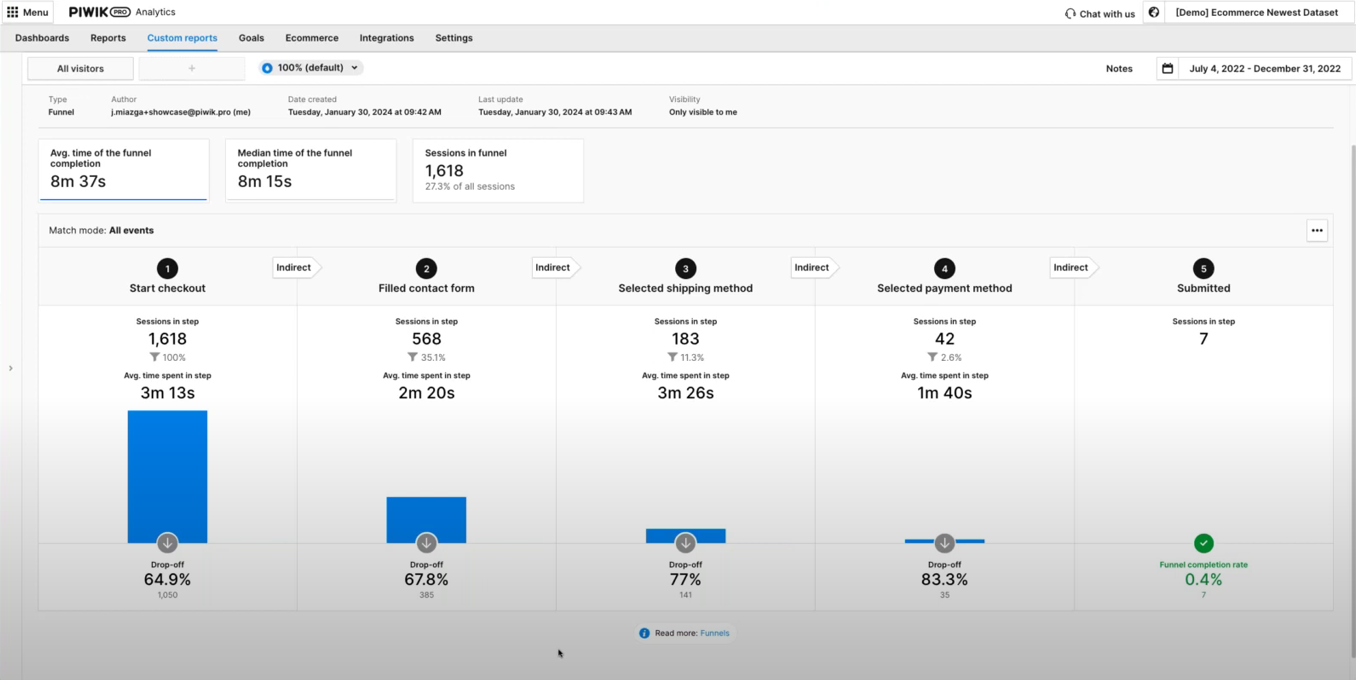
This will allow you to analyze the drop-off points and learn which ones create friction.
Additionally, you can optimize your product pages.
One point of your analysis could be checking the number of product detail views and order-to-detail rates.
For example, a product page that gets a high number of product detail views and a low order-to-detail rate indicates an issue. Analyze your heatmaps to determine what users view on the page, where they scroll, and other aspects of their behavior.
When analyzing the performance of product pages, you should also consider internal search. See what phrases people look for and whether they correspond with any of your products.
WEBINAR
Piwik PRO for ecommerce:
Get data-driven insights to boost your online sales
Watch the webinar recording and learn how to use Piwik PRO Analytics Suite to improve user experience, optimize product pages, and drive more sales.
Experts opinion
Jude Onyejekwe
Marketing Analytics Specialist at Heddy and Hopp, co-founder of DumbData
Ecommerce businesses face a number of challenges in analytics:
- The lack of proper planning and documentation concerning data collection and its purpose
This oversight can lead to a disconnect among the implementation team, marketing, stakeholders, and analysts. As a result, data may not be collected or communicated effectively to other collaborators who require this information.
To address it, involve stakeholders who need the data early in the process. Planning and documenting what data is collected (spreadsheets can be good for a start) will help facilitate collaboration and more effective data utilization across different business units.
- Knowledge gaps and CMS limitations
The types of user actions in the purchase journey that can be measured vary significantly across different CMS platforms. Additionally, the website’s data layer structure can differ markedly from one site to another, complicating data collection, which can be challenging without sufficient domain knowledge. Limitations in tracking user actions on checkout pages due to security concerns are also challenges in this category.
To solve this issue, it’s essential to identify these challenges and limitations inherent in the CMS. Engaging the right experts or resources is crucial to ensure proper data collection as users move through the purchase funnel and interact with your business.
- Silos in the user journey
Ecommerce businesses that have the capability for users to make purchases both on and off their websites, such as in physical stores or via social commerce platforms like Meta, end up having silos in the user journey and can pose significant challenges in collecting data on purchases made outside the website.
The key to addressing this challenge is determining what is feasible and utilizing available resources to integrate data on non-website purchases into your analytics tools. This approach helps create a more unified view of customer interactions and purchase behaviors across all platforms.
How to use data activation in ecommerce
Effective data activation for an ecommerce business requires the right tools. Customer data platforms (CDPs) allow you to integrate data from your CRM, email software, marketing automation tools, analytics, etc. For example, you can import offline conversions from your physical store. On the other hand, you can activate the audience segments using different tools in your stack, such as ad networks, marketing automation platforms, and A/B tools.
There is a range of goals you can achieve through data activation, such as:
- You can increase your revenue by:
- Offering free shipping to first-time customers.
- Providing product recommendations based on products or services that users show interest in.
- Crafting unique purchasing journeys for different customer segments based on their shared traits.
- You can personalize the customer experience by:
- Retargeting users with ads they are most likely to respond to.
- Showing personalized content to users based on the content they’ve consumed.
- Sending customized email campaigns based on users’ purchase history.
- You can improve customer retention by:
- Uncovering customers who haven’t purchased in a while.
- Recognizing potential cross-selling and upselling opportunities using data about previous behaviors and purchases.
- Retargeting users who abandoned their carts.
Since a customer data platform utilizes first-party data, you can control where the data comes from and what happens with it. This helps you better align with privacy regulations.
Privacy compliance in ecommerce analytics
Safeguarding customers’ data and respecting their privacy has become a new standard. The emphasis on privacy and security stems from the growing number of data privacy regulations, higher consumer awareness, and increasing enforcement of regulations.
Ecommerce compliance means adhering to the rules governing ecommerce activities in the markets you sell in. These include but are not limited to ecommerce regulations per se, data privacy regulations, online payment standards, accessibility norms, and the avoidance of dark patterns.
Ecommerce privacy regulations
The focal point of data privacy regulations is processing personal data and protecting consumers’ privacy online. Since your ecommerce regularly deals with all kinds of personal data, understanding and complying with applicable laws is a must. Check what regulations apply to your business, whether laws affecting specific countries, like German TTDSG/TDDDG or French CNIL’s guidelines, or laws with a broader application, such as GDPR, the Digital Services Act (DSA) or the ePrivacy directive.
Privacy-oriented technological changes
The ecommerce landscape is also being affected by technological shifts. The most notable event is the end of retargeting ad campaigns as we know them due to the deprecation of third-party cookies.
To adjust to privacy-facing technological changes, take the following steps:
- Choose privacy-conscious tech providers that build their tools according to privacy by design and privacy by default principles.
- Ensure the tools you use offer features that allow you to respect visitors’ choices or to anonymize data.
- If you run a business in the EU, consider choosing EU-owned and -based tech platforms.
- Prioritize first-party data sources, which means collecting data using your own sources.
Check out our blog post on privacy compliance in ecommerce for an overview of the most important upcoming laws and technological changes.
Experts opinion
Tim Ceuppens
Freelance Digital Marketer
You collect an abundance of data but how should you use it? For example, do you need to see the details of products that are being added to the cart, or is it enough to learn that a specific channel brings more add-to-carts than others? Most companies lack the scale to get accuracy on highly precise data. If I had to choose between these two, I’d always go for accuracy over precision. Think if you’re able to act on this information. If you can’t, or if it takes too long to get a meaningful sample, choose lower granularity.
With GDPR and cookie banners comes a different challenge: Is the data you’re seeing representative of what is happening? Here are two scenarios: One user clicks on a Meta ad, and another one clicks on a Google Search ad. You’ll find that people who are higher in the funnel tend to default more towards clicking the “don’t allow any cookies” option of the banner. People who are lower in the funnel or previous customers tend to select the “allow all cookies” option. In this case, you will be underreporting Meta visitors and overreporting Google visitors. You won’t be able to stitch all of these sessions together to see what contributed to a purchase in a multi-touch funnel.
A major issue with Google’s Consent Mode is that you can’t extrapolate based on what you didn’t measure. Marketers risk turning down channels that are seeding purchases later in the cycle. Back in the day, we solved it by measuring various channels differently. So, we evaluated a higher funnel channel based on how many add-to-carts we saw, and a lower funnel channel based on revenue and purchases. We did this session by session, instead of user by user, to learn whether each session led to a desired outcome. If it didn’t, we analyzed where it went wrong.
Another challenge is making all of this data understandable and relatable to non-data-minded colleagues. I try to make my dashboards and visualizations simple enough for a five-year-old to understand what’s going right and wrong. Complexity only adds more breaking points to advice that usually already needs buy-in from more than one department. You should show the highlights and have the numbers as a backup when asked for. A correct answer, badly given, pushes you off track and forces you to expend energy you could have used for other things.
Best practices for ecommerce analytics
Below we’ve prepared some tips for getting your ecommerce analytics right.
Take a holistic approach to the customer journey
The concept of a holistic customer journey highlights the complex and diverse ways customers engage with brands. You should view different metrics as components of a bigger picture.
Your goals in ecommerce analytics should be to:
- Reduce friction points along the customer journey.
- Increase the customer’s motivation to buy.
You can achieve these by offering a straightforward user experience and helping people complete their selected tasks.
Respond to the expectations of online shoppers
Understanding why people shop online instead of going to a physical store can help you dedicate resources to the most critical areas of your business.
For example, users appreciate online shopping for:
- Being able to shop anytime – Make sure your website and app work seamlessly on different devices.
- Being able to find their product quickly – Ensure the journey to purchasing a product is smooth and quick. Adjust your purchase process to remove any unnecessary or complicated steps.
- Being able to choose from a wide range of products – Find out what products are the most popular with your visitors and which ones they are looking for. See how to adjust your offer to let them buy more of what they need.
Define your KPIs
Defining and tracking the right KPIs is crucial to your ecommerce analytics strategy. Marketers should establish performance indicators specific to every step of the customer journey and evaluate the success of their activities based on these metrics.
For example:
- In the consideration stage, you want to learn more about user behavior and observe patterns to plan improvements and get more sales. Consequently, your KPIs here could include engagement rate, bounce rate, returning visitors, and cart abandonment rate.
- In the purchase stage, you want to convert more users into buyers. Hence you may track metrics such as orders by new vs. returning customers, average order value by channel, revenue by product, and customer lifetime value (CLV).
To learn more about tracking the right KPIs, check out our blog post: KPIs for ecommerce: Maximizing funnel performance.
Integrate the components of your analytics stack
Integrating your data lets you work on accurate, in-depth data sets and apply the insights you’ve gained to benefit your business. You’ll gain a comprehensive understanding of your customers and take action to drive more sales, improve customer retention, and optimize your store to provide a better user experience.
With an integrated analytics platform, you can connect ecommerce data from all your sources with analytics data and make it available to different teams. When choosing the right platform, ensure it meets your teams’ needs, doesn’t strain your resources, and offers a scalable solution that can grow with your business.
Join the dots between your customers and the data
Marketing tools often provide excessive amounts of data – don’t fall into the trap of gathering as much data as possible. You need to have a purpose for every piece of data you collect. Data becomes valuable when you correlate the numbers with your customers. Looking at data in isolation can lead to errors by obscuring the bigger picture.
Adjust data for seasonality and other trends
Analytics lets you uncover trends, identify patterns and discover seasonality. It allows you to better understand your business’s current performance and how it can potentially look in the future. This, in turn, lets you make more accurate business forecasts that can inform your future actions.
Monitor your product performance over time
Tracking product category and individual product performance over time will enable you to discover your biggest revenue drivers and what you should invest in. It’s a great place to begin if you want to find out what products are performing well and which aren’t doing as well as anticipated.
Ecommerce marketing: How to get enhanced online store analytics
Check out our masterclass and learn how to go beyond ecommerce analytics with Piwik PRO to act on customer insights and drive more sales.
Conclusion
Ecommerce businesses deal with uniquely large volumes of data. However, many truths are the same for organizations in all industries that rely on analytics. Specifically, the road to success is paved with understanding which data points are essential and using that knowledge to continuously improve customer experience.
Interested in learning how Piwik PRO Analytics Suite can help your ecommerce business surface valuable insights?
The post What is ecommerce analytics and how can you use it to grow your business appeared first on Piwik PRO.
]]>The post Digital marketing analytics: The beginner’s guide to data-driven marketing success appeared first on Piwik PRO.
]]>However, to ensure that your efforts contribute to business growth, you need to measure the results of your activities.
Digital marketing analytics is a great method to determine the effectiveness of your efforts and discover areas for improvement.
This article will explain how to measure your results and use the insights to enhance your marketing performance.
What is digital marketing analytics?
Digital marketing analytics is the practice of gathering, analyzing, and interpreting data to make informed decisions and improve marketing performance across all your channels.
These channels may include social media, websites, ad campaigns, or search engines.
That’s why digital marketing analytics is vital in helping you understand and use this data about your performance in these channels to improve your marketing results.
What are the sources of digital marketing analytics data?
When thinking about marketing analytics, you probably come up with some widely-known metrics that help gather basic information about visitors, such as:
These metrics give you a basic overview of your audience and show how they interact with your website – a great starting point for future marketing decisions.
However, that’s barely the tip of the analytics iceberg. In the Key metrics for marketing analytics section, you’ll learn practical tips that let you dig even deeper under the hood of your website, campaigns, newsletters, and others.
But first, let’s learn why analytics is such a crucial component of your marketing stack.
Why is digital marketing analytics important?
As markets become increasingly competitive and consumer behaviors more complex, data-driven marketing strategies become a must.
Advertising is becoming more expensive and ineffective. Why? Because there is more and more advertising. This is precisely why analytics is becoming increasingly indispensable in marketing. Marketing must once again set the tone through target group-oriented communication and advertising that focuses on the customer.
~ Philipp Loringhoven, Freelancer for Marketing Analytics and Strategy
By analyzing data from various sources, you can identify patterns and trends in customer activities. This information is extremely valuable for creating marketing campaigns that target your audience effectively and resonate with them.
When you tailor marketing efforts to specific segments, you use the company’s resources more efficiently. This is a clear win-win situation for both parties: Users get what they require, whereas your company grows its sales and optimizes ROI.
But don’t just take our word for it. See how companies use web analytics to increase their ROI and conversions:
Key metrics for digital marketing analytics
Key performance indicators (KPIs) help you evaluate if you’re getting closer to your goal. As a marketer, you should rely on accurate metrics, ask precise questions, and provide answers to those questions based on reliable data.
But first, you need to know how to arrive at the right KPIs for your organization. Every company has different goals and achieves them in different ways. That’s why you can’t make actionable decisions based on one-size-fits-all KPIs.
This makes defining your strategy and key performance indicators a priority. To start, you need to answer the following:
- What’s my company’s goal? Focus on one goal. As a rule of thumb, this will be profit-related.
- What are the goals for each of my marketing activities and channels?
Here, think of the various marketing activities you take and channels you use, and determine goals for each. For example:- What are the goals of my website?
These will usually include generating leads, account sign-ups, closing online transactions, etc.
- What are the goals of my paid campaigns?
Typically, these might include increasing brand awareness, generating leads, or driving direct sales.
- What are the goals of my newsletters?
Newsletter goals often focus on nurturing leads, enhancing customer engagement, or promoting specific products or events.
- What are the goals of my website?
- What data will show me that the website goals are being met?
Decide which data will be assigned to each goal. This might not be clear yet, so you can come back to this question later.
In the next step, use the S.M.A.R.T principle and ask questions that are:
- Specific: What exactly do I want to achieve?
- Measurable: How will I know that the goal has been achieved?
- Achievable: Is my goal realistic?
- Relevant: Is the goal relevant to me? Will it take me where I want to go?
- Time-bound: When should the goal be achieved? What milestones are there?
By setting these goals, you narrow down the data range you will work with. This helps you choose the right KPIs for your analysis.
Actionable metrics vs. vanity metrics
To make informed decisions, you must differentiate between actionable and vanity metrics. The success of your analytics strategy lies in focusing on metrics that truly matter to your business and provide actionable insights rather than just pretty numbers.
What are actionable metrics?
Actionable metrics provide clear insights that you can act upon. They are directly tied to your marketing and business goals, allowing you to keep them in check.
Examples of actionable metrics include:
- Organic traffic and content performance
Organic traffic is often considered high-quality. It represents an interest from people who naturally stumble upon your site while exploring the web, rather than being led there by ads. However, it’s crucial to analyze the content that drives this traffic.
For instance, if 90% of your organic traffic comes from one blog post, your content strategy needs improvement. By diversifying your content, you can mitigate risks and ensure a more stable traffic inflow. - Conversions
By analyzing the number of conversions, the conversion rate, and the context in which these conversions occur, you can gain a more in-depth understanding of the effectiveness of your marketing strategy.
For example, having a conversion rate of 50% may appear impressive, but it becomes less significant if the rate is based only on two visitors. For a more extensive visitor base of 100,000, the same conversion rate would carry more weight. - Meaningful data ranges
The importance of data can differ significantly based on the amount of data available.
For example, a 5% conversion rate from 10 visits is statistically insignificant, whereas the same rate from 100,000 visits can provide useful information.
What are vanity metrics?
Vanity metrics might seem impressive at first glance, but they don’t offer real, actionable insights. They can be misleading and present an overly optimistic view of the website’s performance without the necessary context.
Examples of vanity metrics include:
- Overall website traffic and pageviews
Without the context of conversion data or segmentation (like channel, location, or device), these metrics provide you with little to no actionable insight.
They can give you a false, inflated view of your website’s performance without indicating any real success in engaging or converting visitors. - Paid media traffic
Traffic generated from paid sources is often deceptive. While it can boost your numbers, it doesn’t necessarily translate into value for your business, especially if it doesn’t result in conversions or higher user engagement.
- Poorly defined conversions
Knowing the number of conversions without understanding the conversion type (micro vs. macro) or the broader context can be misleading.
For example, when a visitor clicks on a ‘Submit form’ button, but doesn’t send the form because of an error, you shouldn’t count the click as conversion. After all, the form was ultimately not sent. - Data without context
When you analyze metrics in isolation, without considering the broader context, it can lead you to misguided conclusions.
For example, a low bounce rate might seem positive at first glance. But if you don’t compare it with data like the conversion rate, it provides little to no insights. That is to say, it may turn out that the visitors who don’t bounce also don’t convert later on.
Best practices for choosing the right actionable metrics
When choosing actionable metrics, consider the following best practices:
- Relevance: Ensure the metric aligns with your marketing and business goals and help you make more informed decisions.
- Context: Always analyze the metrics within the broader context of your business, like changing industry trends or customer behavior.
- Consistency: Use consistent methods and time frames to ensure reliable comparisons of the measured metrics.
- Actionability: Choose metrics that offer insights leading to specific, actionable steps, not just numbers to admire.
If you want to learn more about setting and analyzing your goals, visit our help center article Use goals to focus on important things.
Useful analytics reports for marketers
Now let’s dive into the meat of this guide and learn how to use web analytics to gain valuable insights and boost your marketing efforts.
Optimize your content with the content performance report
Measuring content performance allows you to pinpoint pieces of content that capture your audience’s attention. It helps you understand their interests and identify areas for improvement.
A data-driven content optimization strategy may lead to higher user engagement, increased traffic, and better conversion rates. This can only be achieved by consistently analyzing and adjusting your content strategy based on data.
That’s why a reliable content performance report is a true game-changer. It shows how many times people viewed and interacted with different parts of your site, like banners, popups and contextual ads, by providing the following metrics:
- Content impressions
- Unique content impressions
- Content interactions
- Unique content interactions
- Content interaction rate
By analyzing this data, you can identify the content elements that engage your visitors and those that don’t. This allows you to improve underperforming elements and replicate the successful ones elsewhere on your website.
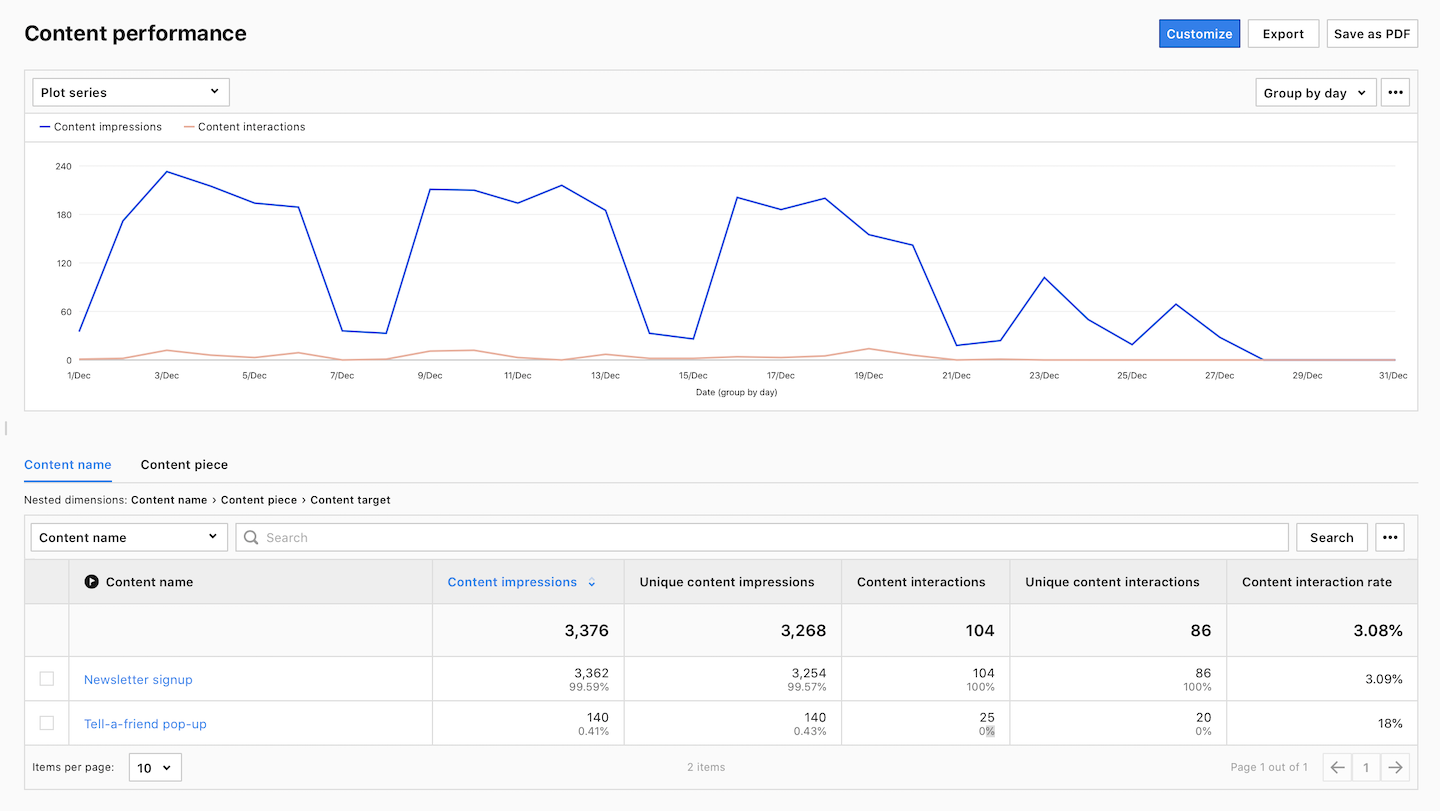
To learn more about measuring content performance, visit our help center article.
Improve SEO performance with Google Search Console integration
Integrating your analytics platform with Google Search Console is crucial for detailed search analysis and refining your SEO tactics. Doing so will allow you to see specific searches people run on Google before visiting your site and the web pages they landed on.
But the list doesn’t stop there. The Google Search Console report provides information about your site’s performance in Google through the lens of four key sections. Each section is reflected in a different set of metrics.
- Landing pages: Impressions, Clicks, Sessions, Bounce rate, Average time on page, Goal conversion rate.
- Keywords: Impressions, Clicks, CTR, Average position.
- Devices: Impressions, Clicks, Sessions, Bounce rate, Goal conversions, Goal CTR, Sum of goal revenue.
- Countries: Impressions, Clicks, Average position.
Whether it’s tweaking landing page content to increase user engagement or refining keyword strategies for better search visibility, this report is a cornerstone for data-driven SEO strategies.
Monitoring device metrics will help you ensure optimal user experience across all platforms, which is crucial for maintaining low bounce rates and high conversions. Additionally, gaining insights into specific geolocations can help you tailor your SEO tactics to enhance visibility in the key markets for your business.
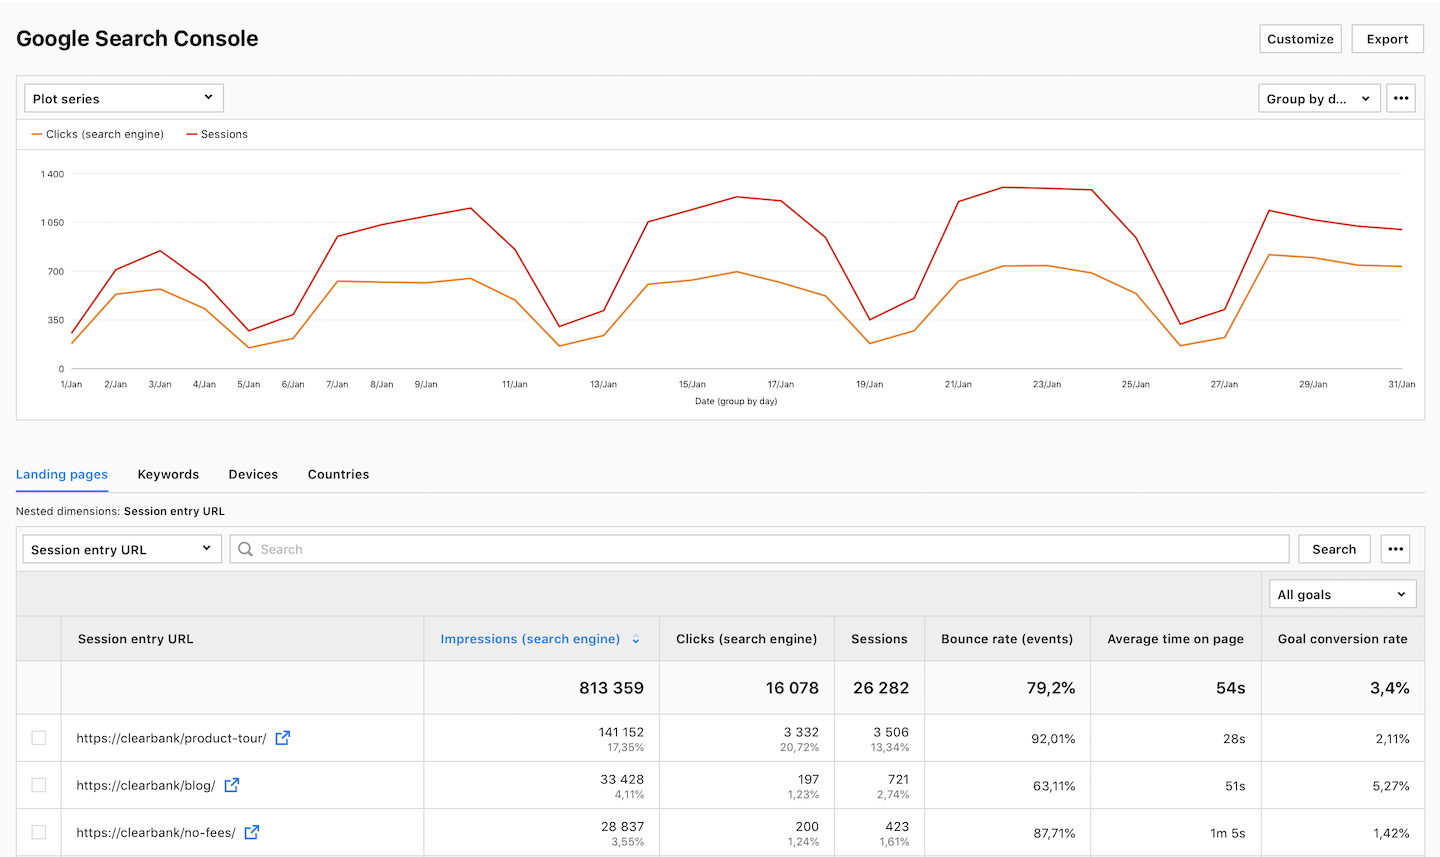
To learn more about improving SEO performance, visit our help center article.
Boost the ROI of your paid campaigns with Google Ads integration
Linking your Google Ads account with your analytics platform lets you see which campaigns are doing a good job at driving traffic to your website and converting visitors into customers. This way, you can refine your campaigns, allocate more resources to high-performing ads and pause those that are not generating results.
Analyzing the Google Ads data provides you with in-depth insights into how users interact with your ads, helping you optimize your ad copy and target keywords better. This, in turn, leads to more effective ad placements, improved click-through rates, and increased conversions.
The Google Ads report consists of 8 subreports:
- Accounts connected to your analytics platform.
- Campaign performance of the campaigns set up in Google Ads that bring traffic to your site.
- Ad group performance of the ad groups set up in Google Ads that bring traffic to your site.
- Keyword performance of the keywords set in Google Ads that are used to show ads.
- Landing pages with the URLs of the pages where visitors were directed from ads or keywords in Google Ads.
- Ad performance of the ads set up in Google Ads that bring traffic to your site.
- Performance by day of week with the amount of traffic generated by your ads on each day of the week. It combines data on clicks, costs, and goal conversions.
- Ad distribution network with data about where your ad was displayed.
Furthermore, the Google Ads report provides you with insightful metrics, including:
- Clicks – the number of clicks on your ad.
- Average cost per click – the amount you paid for your ad divided by the total number of clicks.
Average CPC = (Cost / Click) * 100%. - Click-through rate (CTR) – measures how often people click on your ad in Google Ads after it’s shown to them.
CTR = (Clicks / Impressions) * 100%. - Return on ad spend (ROAS) – shows whether your Google Ads ad spend has resulted in conversion revenue.
ROAS = (Goal Revenue + Ecommerce Revenue) / Cost (Google Ads)) * 100%. - Goal conversions – the number of goals completed in a session by users who reached your page via your Google Ad.
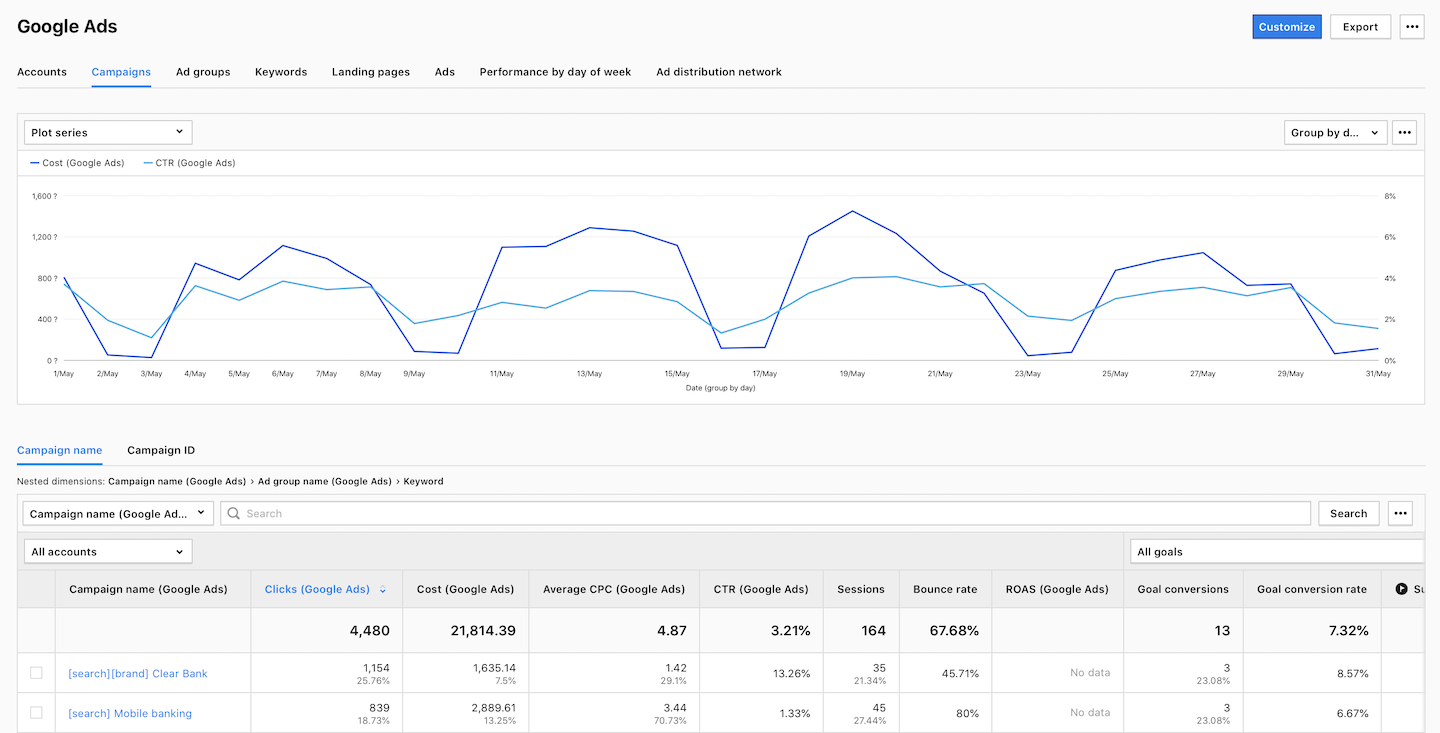
To learn more about boosting ROI of your paid campaigns, visit our help center article.
Optimize conversion paths on your website with funnel reports
Funnel reports can help you identify bottlenecks that hinder user experience, streamline conversion paths, and reveal other areas for improvement.
Identifying and minimizing the friction in conversion paths is crucial for a better user experience. The funnel reports allow you to analyze each step of the customer journey on a website and gain a clear understanding of your audience’s interactions.
To generate a funnel report, you should determine the typical steps (visited pages or specific interactions) that visitors follow to achieve a goal. After identifying these steps, you can analyze how many visitors successfully completed each stage and pinpoint where they are most likely to drop off.
For example, if you want to measure how many visits that started on a home page reached the signup page, you could create a funnel consisting of the following steps:
Home page –> Product page –> Click a signup button –> Signup page
The report will then generate an overview of the whole path divided into individual steps with the drop-off percentage:
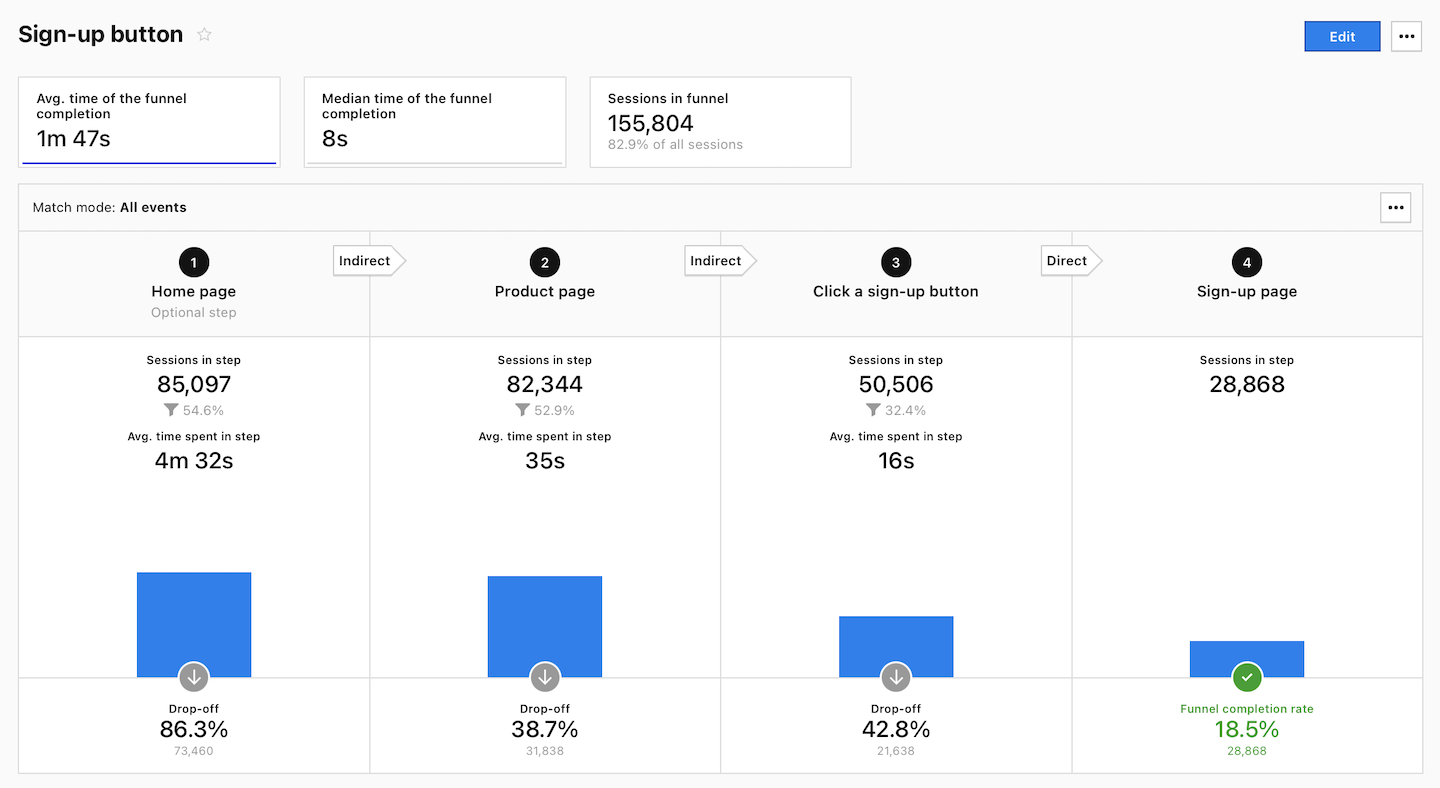
To learn more about optimizing conversion paths, visit our help center article.
Read our guide and see how you can analyze the conversion funnels on your website: Conversion funnel analysis: A step-by-step guide.
Evaluate newsletter performance with UTM tags
Newsletters are essential to many digital marketing strategies as they directly engage your target audience. However, you must track how much traffic and conversions they drive to determine their effectiveness.
This is where UTM parameters come into play. By adding them to your newsletter links, you can gain valuable data insights on how recipients interact with your content and what actions they take as a result.
UTM parameters are added to the end of a URL. They help marketers track the performance of various online campaigns across traffic sources and publishing media, including emails.
In a newsletter scenario, each link included in the newsletter (such as blog post link or CTA) can be equipped with the same set of parameters, like in this example:
https://www.example.com?utm_source=newsletter&utm_medium=email&utm_campaign=winter_sale&utm_term=marketing_analytics&utm_content=cta_1A standard UTM-tagged URL comprises the following five parameters:
- Source (utm_source): Identifies the traffic source. In this case, it’s a newsletter.
- Medium (utm_medium): Defines the medium where the link was used. For a newsletter campaign, this will usually be an email.
- Campaign (utm_campaign): Specifies the campaign or promotion name.
- Term (utm_term): Used for paid search to identify keywords. You can use it to segment different newsletter topics or subjects within the same campaign.
- Content (utm_content): Differentiates similar content and can be used for A/B testing different call-to-actions (CTAs) or other content elements within the same newsletter.
Note: When tagging a link, it is good to include at least three parameters: source, medium, and campaign.
Integrating UTM tagging strategy lets you track how recipients engage with your newsletters. This data can be invaluable for refining your content strategy, optimizing your call-to-actions, and improving overall user engagement.
Doing so, you can determine the effectiveness of one newsletter against another or compare its performance to other marketing channels. This gives you an idea of which newsletter topics resonate most with your target audience and how to plan future campaigns accordingly.
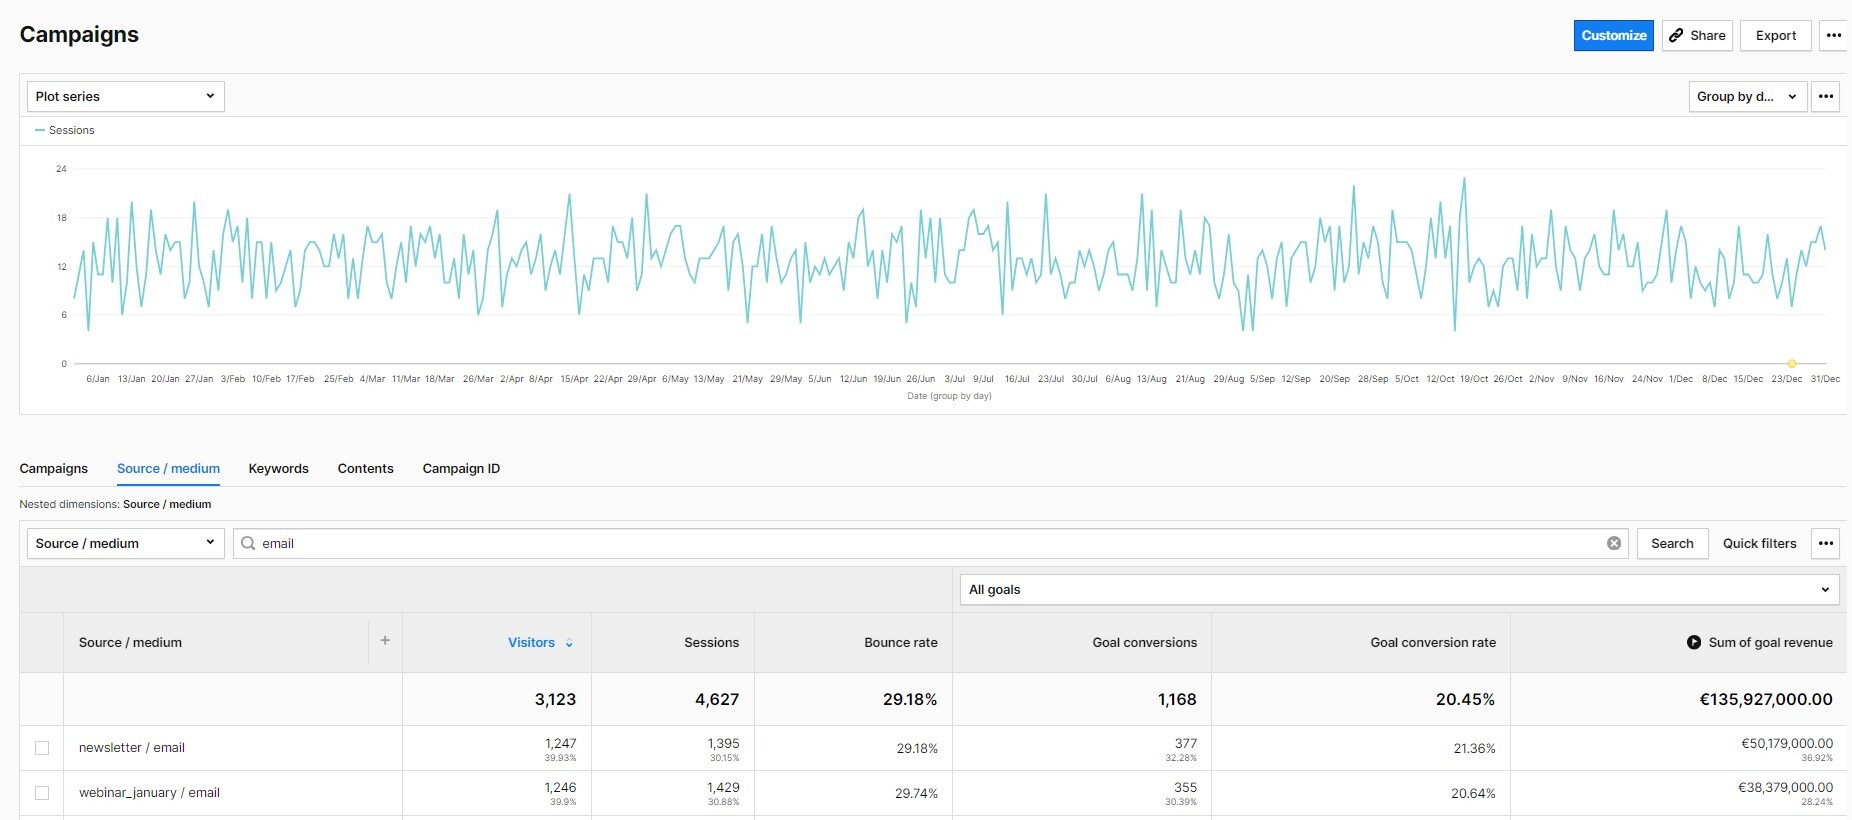
By understanding what works and what doesn’t, you can tailor your newsletters’ content, design, and CTAs to better align with your audience’s preferences and behaviors. This, in turn, will help you to use your marketing budget more effectively.
Watch our free webinar to learn more about UTM tagging best practices and making smart marketing budget decisions.
Customize reports to your needs
Again, this is just a portion of what you can do with reports in the Piwik PRO Analytics Suite. With customizable dashboards, reports and numerous integrations, your analytics options are practically limitless.
Digital marketing analytics doesn’t end with choosing the right metrics. It’s also about keeping up with the latest market trends. Let’s take a closer look at some of them.
Current trends in digital marketing analytics
It is important to stay updated on the latest digital marketing trends, as it helps to keep your mind fresh and open to new ideas.
This way, you will be better prepared for any changes that may occur, such as new privacy laws affecting your business or the deprecation of third-party cookies in popular browsers.
However, not all marketing trends are equally valuable, and they should never replace a solid marketing strategy and proven tactics.
Hence, you should prioritize the trends that are worth your time and effort. We’ll describe some of them below.
Data privacy in marketing analytics
With the growing number of strict privacy laws around the globe, data privacy has become an integral part of marketing analytics. This necessary change gave customers more control over their data, making the collection of their data dependent on their explicit consent.
The ubiquity of privacy regulations has made marketers seek privacy-compliant data collection strategies. Not only to avoid hefty fines, but also to build customers’ trust as privacy awareness grows among them.
As the example of anonymous tracking shows, it is still possible to gain valuable data insights while respecting users’ privacy. One of the keys to compliant data collection is the integration of analytics and consent manager modules.
Another way of respecting users’ privacy is collecting and analyzing data that comes directly from them, known as first-party data. This is because third-party tracking raises privacy concerns and has become increasingly difficult due to the privacy settings on browsers and the popularity of ad blockers.
To learn more about the benefits of first-party data in marketing analytics, check out our articles:
Moreover, having your web analytics synced with a consent management platform, like Cookie Information, will further increase the privacy compliance of your data collection.
If you want to learn how to ensure privacy compliance in your marketing analytics, check out our masterclass webinar Privacy and marketing: How to do powerful analytics with less data.
Data integration in marketing analytics
Data integration is a process of combining customer data from different sources and systems to create a unified view of customer behavior and preferences, also called a single customer view.
By integrating data, marketers eliminate data silos and gain a comprehensive understanding of their customers. This helps develop effective marketing strategies to improve customer engagement and retention.
It is important to recognize patterns and use them for targeted communication. This is how customer-oriented companies operate. When they combine data from sales, support, or shipping to display messages at the right time in the right format on the right channel, consumers feel that they are being taken seriously. Sometimes this is email, sometimes letter, or sometimes voice messages. And as marketers, we want customers to feel better about our service because that ensures a better repurchase rate.
~ Philipp Loringhoven, Freelancer for Marketing Analytics and Strategy
To integrate data, the first step is to gather it from various sources like websites, mobile apps, advertising platforms, and offline interactions. This data is then stored in a centralized location known as a customer data platform (CDP). The CDP functions as a hub that consolidates all the data in one place.
After you have collected the necessary data, the next step is to analyze it. You can examine past data, discover patterns, and highlight trends. This analysis reveals valuable insights about customer behavior, such as cart abandonment rate, browsing patterns, demographic information and much more.
These insights give you a more in-depth understanding of your target audience, allowing you to customize your marketing strategies accordingly. That said, you need to make sure that your analytics platform offers many integration options with the most popular marketing tools.
According to the Replacement Survey 2023 by Martech, data integration capabilities are one of the main reasons why marketers replace their current software.
Data activation in marketing analytics
Once the data is collected, it can be sent to various tools and platforms such as email marketing platforms, ad platforms, personalization software, marketing automation tools, or CRMs. This practice is called data activation, and it serves as the bridge between data collection and its practical application.
Data activation goes beyond mere data analysis and implements findings in real-world scenarios. This includes tailoring marketing campaigns, optimizing customer experiences, and improving product offerings.
1-to-1 personalization is not always necessary. Especially not for the first few contacts. But we all know that the more someone is interested in us and our current needs and responds to it, the more likely we are to buy. The best current example is my bookseller. His recommendations deviate from the norm but are based on historical data. That’s why I trust him more than any “review” lists. That’s customer loyalty!
~ Philipp Loringhoven, Freelancer for Marketing Analytics and Strategy
By activating data, you can respond to consumer needs and market changes in real-time, leading to increased user engagement and conversions.
For example, you can create customer segments based on specific behaviors or demographics and target them with personalized marketing campaigns. Or identify potential customers who have shown interest in your products, but haven’t converted, and plan steps to encourage them to make a purchase.
Want to learn more about data activation? Check our data activation playbook.
Conclusion
We have discussed the essential metrics and reports that can help you measure and optimize your marketing activities. Hopefully, what you’ve learned will help you adapt to the new trends, come up with new ideas for improving your digital strategies, and succeed in your work.
If you’d like some help in choosing a product for analyzing your digital marketing performance, here you can find a detailed comparison of 10 web and app analytics platforms. Download for free and see which of them is right for your needs:
COMPARISON
The comparison of 10 web and app analytics platforms
Learn the key differences between Piwik PRO Enterprise, Google Analytics 4, Matomo Cloud, Adobe Analytics, AT Internet, Countly Enterprise, Mixpanel Enterprise, Amplitude Enterprise, Snowplow Enterprise, and Heap Premier.
Digital marketing analytics with Piwik PRO Analytics Suite
Having an analytics platform that consists of multiple cooperating modules like Analytics, Consent Manager, Tag Manager, and Customer Data Platform gives you practically limitless options for working with your data, from ensuring world-class data privacy to data activation and integration.
Piwik PRO Analytics Suite is a flexible analytics platform trusted by over 10,000 professionals, including organizations like Crédit Agricole, the Government of the Netherlands and the European Commission.
It helps you easily collect data about your audience in a privacy-friendly way. With the gathered information, you can better understand how people interact with your company and use those insights to improve conversions.
Try Piwik PRO for free, or book your exclusive demo.
The post Digital marketing analytics: The beginner’s guide to data-driven marketing success appeared first on Piwik PRO.
]]>The post Conversion funnel analysis: A step-by-step guide appeared first on Piwik PRO.
]]>Why conversion funnel analysis is important
Using funnel reporting has several benefits. You’ll see the areas of your website or app where you need to make upgrades. Analytics data from funnel reports highlights places and stages of the journey where people often exit pages. That is vital, because it tells you what places you should focus on when revamping your site. While these insights don’t directly tell you what to fix, they provide clues of great value for optimizing your customer’s journey.
Goal setting and funnel building
Setting clear business goals goes hand in hand with creating funnel reports. Depending on the type of company, those goals vary. Maybe you are interested in leveraging your social media or driving product sales. Once you have an idea of what to improve, you design funnels to help you analyze how your current website or app works towards your objectives.
Goal setting
To set up an effective funnel report, first decide on some long-term goals for your business. Possible goals could be to build your online community or to grow business from repeat customers. If one of your goals is to better utilize your social media, then apply a funnel report to measure how many people find your website via your social accounts.
Conversion funnel building
After you’ve established your business goals, brainstorm ways your website or app can help you reach them. When you decide on a path you think your customers take through your website, create funnel reports to find out how people actually navigate it. These reports show individual paths that users take.
Say you want more people to complete the checkout page or to sign up for your company’s newsletter. Thanks to a funnel report, you’ll see how visitors move through pages and where they leave. That information will help you remove obstacles and smoothen the paths for visitors.
From a technical perspective, funnels consist of steps. It’s important to add every part of the journey you analyze so you’re not missing any relevant information. For a website, use as steps events like:
- Button clicks
- Page scroll percentage
- File downloads (e.g., whitepaper, infographic)
- Requesting a demo
When analyzing how visitors use apps, the possible events are:
- Screen views
- Button presses
- Using a particular item (for games)
- Searches
Start your analysis with the focus on pages with high traffic, but also high drop-off rates. These are the areas you’ll want to improve.
Keep in mind, it’s natural to see a drop-off in the number of customers in a funnel. Not everyone who visits your site is going to buy something or complete a transaction. However, funnel reports give you data that enables you to take necessary actions to raise conversions.
Read more about funnel reports in: Funnels based on behavioral segmentation: a little-known way to map the entire customer journey
Now, let’s take a look at different examples of how people navigate your website.
Use case #1: Visitors move from the homepage to the product page, ending in a demo request
You have planned a customer journey with these steps:
- Someone visits your website. On your homepage, they have an overview of your business and services.
- If you’ve captured their attention, they enter the product page to find out more.
- If they like what they see, they request a demo. This is the final step of the conversion you had in mind.
Depending on the outcome you’re interested in, you can choose a different last step. For example, you want the journey to conclude with the visitor making a purchase. Or you have a more complex process, where you break down the demo request into the following steps:
- clicking the request link
- filling out the form
- hitting the submit button
The key is that you have a mapped-out process with multiple steps for measuring progress.
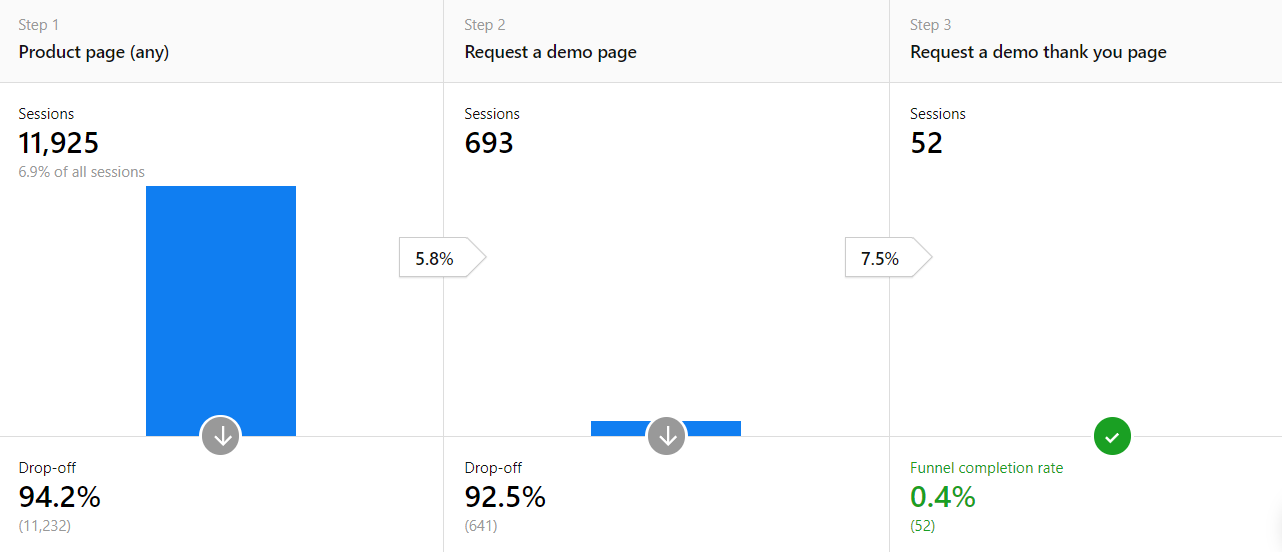
To see if customers followed your planned journey, set each event as a step and consider the structure of your website.
In this example, the first step could be any of your product pages:
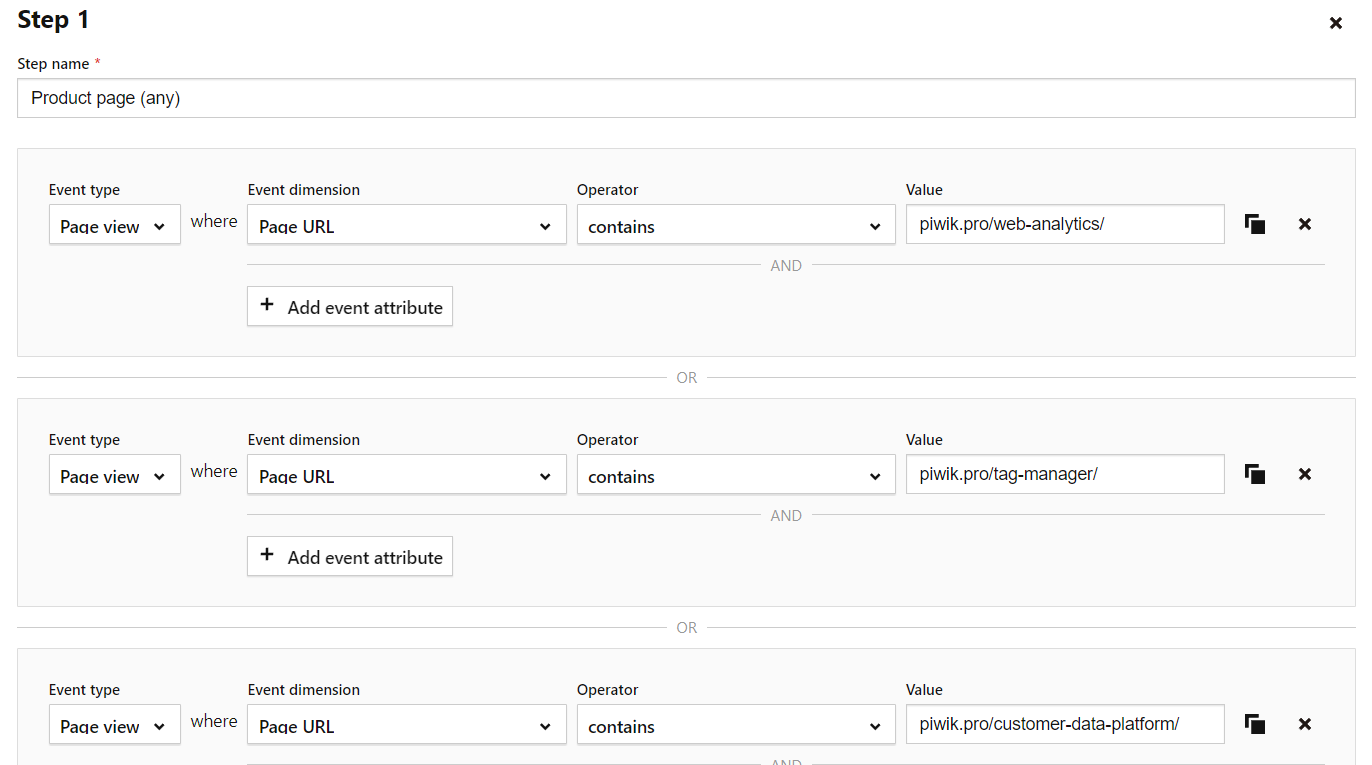
Here, it’s possible to check how many people are going from product pages to a demo request page with a form.
You could also duplicate this report and change the first step to a different part of your website, such as to your homepage or a blog post.
Use case #2: Users submit contact information
In this use case various events, not different URLs, work as steps in the customer’s journey. In addition to different web pages, you’re able to use custom events. Some analytics platforms also use virtual page views to build funnel reports.
For this journey, you’ve designed a landing page with the goal of capturing leads via users submitting their emails or other contact information. Form optimization and funnels make a great match. You can see, field by field, where visitors lose interest and where to make changes. Your steps might look like this:
- A visitor lands on the contact page.
- They click on a button that scrolls them down to the contact form, and they fill out the form.
- After submitting their data, the visitor reaches the thank you page.
That means your goal has been achieved.
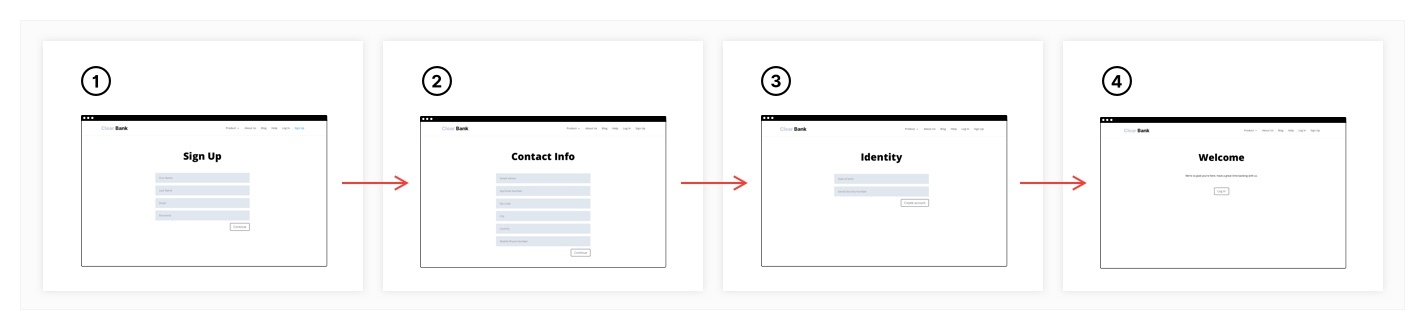
For long forms requiring a lot of information to fill out, divide the fields into multiple pages so you don’t overwhelm the visitor. Then, your funnel’s steps would include reaching the next page(s) and all resulting fields.
Analyze your conversion funnels
After you’ve created your funnel reports, you can spot places with technical or design-related issues. While you won’t know exactly what’s causing visitors to leave a website or abandon their cart, you know which page to look at.
The easiest way to check on those pages is to visit the site yourself to verify if the interface is uncluttered and working properly. For example, check your drop-down menus and buttons for technical problems.
It’s also important to see if the website’s navigation is clear so visitors don’t get stuck. They could be clicking on the wrong part of a page. Using your site to collect information about visitors and their interests is one part of the process, and digging into analytics data is the next step.
To visualize what analyzing funnel data looks like, let’s examine the following case.
Use case #3: Using an online tool with email confirmation
In this use case, we will discuss a scenario of renting a car online.
- The visitor fills in an online form, indicating in which city they’ll pick up the car.
- The second page gives the visitor options, such as different models and the dates available. To register for the car, the visitor must provide an email address.
- The final page is a confirmation that the information about the rental has been sent to the visitor’s inbox.
This way, you visualize the whole process, then check for any potential bottlenecks.
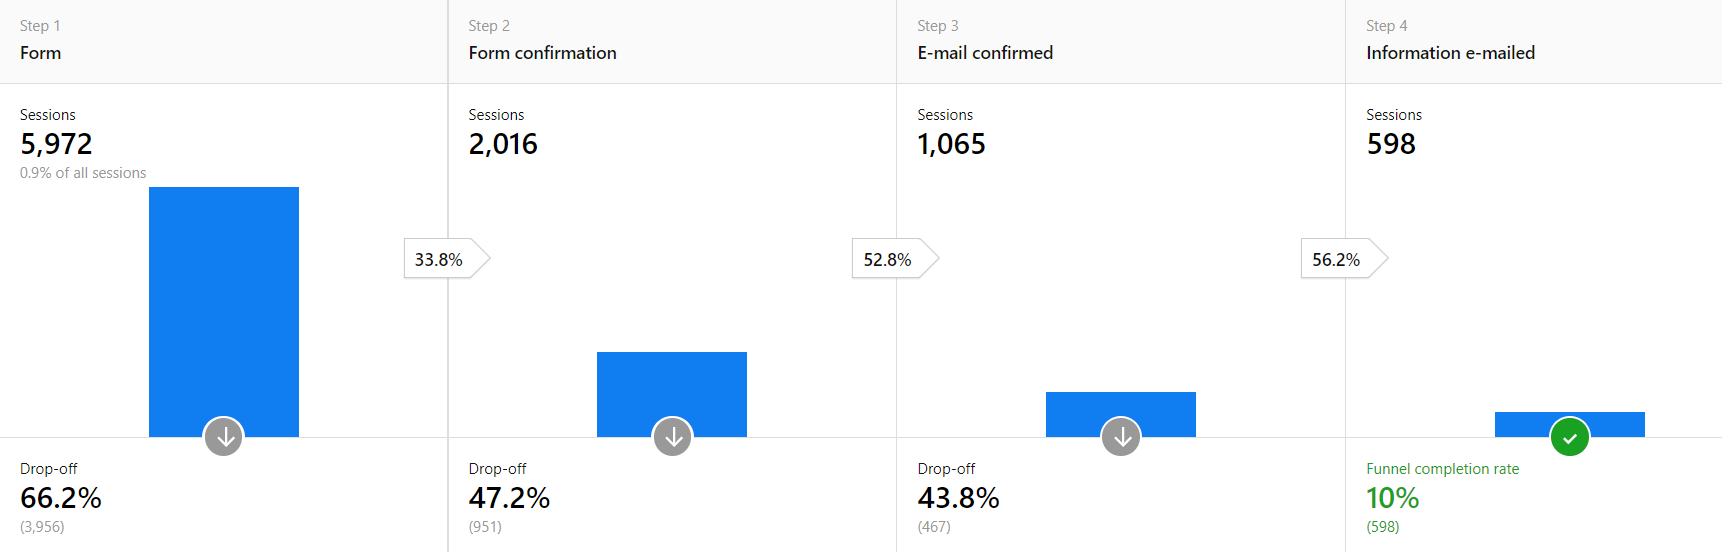
A significant drop-off after the first step is expected. Not everyone is willing to share their contact information.
However, the drop-offs after steps two and three shouldn’t be as high as shown here. If someone’s already filled out the form, most people would finish the process to get the information they want. This funnel report lets you discover places with potential issues.
Once you’ve identified these problem areas, it’s time to enhance your website or app. For instance, if you find you are losing visitors after the trial stage of your product, you may need to expand or refine the onboarding process.
Or, visitors leave without completing the form. The cause might be that the form doesn’t display all the fields, the form refuses special characters or letters, or the instructions are unclear.
How to utilize funnel reporting to make improvements to your website or app
The analysis of your funnel report enables you to understand which elements of your process you can improve to achieve more conversions. Depending on the nature of the problem, consider the following courses of action:
- Enhance the user experience for different devices and operating systems. Let’s say you apply a device type segment, then you find that the majority of drop-offs come from mobile users. This could mean your site doesn’t have a responsive website – maybe the drop-down menus don’t function properly, or your images don’t display correctly on a mobile device.
- Add triggered pop-up windows with free shipping or a discount code to your remarketing campaigns, offers, and push notifications for users who don’t complete funnels.
- Exclude problematic segments and audiences from your campaigns, such as high traffic from a certain country, but one where visitors don’t convert. That’s a clear signal to remove that demographic from paid promotion. This way you decrease the acquisition cost for these groups and increase the effectiveness of your marketing initiatives.
Doing follow-up research: testing your ideas
After you’ve reworked your website, periodically monitor your page views, bounce rates, time on page, and so on, to see if your modifications are working. Give the changes time to build up enough new data before analyzing your traffic and website performance.
Read more about enhancing your website in: 10 things to consider for improving user experience with web analytics
Remember, it’s good to customize funnel reports for different visitor groups and browser types. It’s also possible to adjust those reports to your business and the type of goals you want to measure.
All that being said, funnel reports will point you in the right direction of what places to start working on to improve conversions from your website or app.
If you’d like to find out more about analytics platforms that help you with funnel reporting, see our articles and comparisons:
- Web analytics tools comparison review and sheet: Which solution will be right for you?
- Compare 7 free web analytics platforms (product analytics included)
- Piwik PRO vs. Google Analytics 360
- Piwik PRO vs. Matomo
- Piwik PRO vs. Adobe Analytics
The post Conversion funnel analysis: A step-by-step guide appeared first on Piwik PRO.
]]>The post 10 things to consider for improving user experience with web analytics appeared first on Piwik PRO.
]]>According to HubSpot, 42% of people leave websites because of poor functionality. Also, 38% of users visiting a website for the first time go through its layout and navigation menu. They may leave your site quickly if they can’t find their way around easily.
You might be wondering if your website interface is user-friendly and easy to navigate. Can your potential customers find the information they are looking for quickly? Do they know what to do next? Are there any features or functionalities they find confusing? These are the kinds of questions you need to ask if you want to improve your website.
Web analytics won’t generate straightforward answers. But it will give you valuable insights into how your site performs and how your visitors behave so you can identify areas in need for optimization.
In this article we’ll explain what you need to think about in order to make your website stellar and how analytics software helps you achieve that goal.
Why web analytics is important in user experience analysis
Improving the user experience (UX) of a website requires data, and lots of it. It’s essential to know what visitors expect if you want to create a website that is user-friendly, engaging and prompts them to take a specific action, like buying your product. Great user experience is what differentiates a high-converting website from a page with many visitors who never become your clients.
Often, your website is the first touchpoint for many of your potential clients. That visit becomes their first impression of your brand. This impression, positive or negative, will determine whether they will stay with your business or not.
There is a simple rule: if people can’t find it, they can’t buy it. If a user finds it difficult to use your website, they might decide it’s not worth the trouble. So, creating a positive user experience helps you increase conversions and repeated visits.
And this is where web analytics comes in handy. It allows you to measure a website’s effectiveness and gives you knowledge on how users navigate a website.
With web analytics you can track:
- views
- click
- active users
- how much time users spend on your page
- what pages they visited
- when they exited
- what they searched for
Check out our success stories on how good user experience can improve your product and customer satisfaction:
10 things to consider for better user experience
Today’s web analytics platforms can give you plenty of data you need. Combine it with research, measurement, and analysis and you can easily create and maintain a user-friendly website that performs well. We have prepared a list of things you need to pay attention to if you want to optimize your website.
1. Traffic acquisition
Traffic acquisition data is basically:
- the total number of website visitors
- how visitors got there in the first place
- what pages visitors spend most time on
With traffic acquisition data you can determine traffic sources such as Google, Bing, Yahoo, direct, email campaigns, etc. You can even generate page-specific reports that will tell you where the traffic to the page originated.
Here you’ve got two possible scenarios of analyzing traffic data:
Scenario #1
Your website traffic has declined gradually over time even though you are running marketing campaigns as usual, and the market’s interest in your product or services has been stable.
In such a case, a good place to hunt for a source of trouble would be in your traffic sources report in your analytics platform. Is there a particular traffic source causing this drop in visitors numbers?
Let’s say you identified that you have been getting significantly less traffic from organic search. This may indicate that you need to pay attention to search engine optimization (SEO).
Scenario #2
You’re running a campaign advertising free online marketing courses. The landing page generates high traffic but has a low conversion rate. It turns out that, after clicking the action button in the ad, visitors are taken to a page full of courses and get lost looking for the free ones. They feel that what your ad promised couldn’t be easily fulfilled. Confused, they leave the page as they experience a so-called message mismatch.
That might be the reason for low conversion rates. A custom web analytics report can help you spot that issue in your marketing campaigns.
2. Audience
If you want to optimize your website, you need to know your audience better, both the target audience and the actual one. This knowledge will help you adjust your offer to their preferences and later find the right demographic group for usability testing and improvement.
Analytics can provide you with audience demographic data including age and gender, location, but also with information on what devices they use. This will enable you to segment your visitors and identify where a given part of your audience is struggling with or leaving your website.
Then, look at your proportion of new vs. returning visitors. If you have many returning visitors, you should think about how to keep the site relevant and interesting to this audience.
Finding out which countries and cities your visitors come from helps you decide whether you should modify some features so your website feels more familiar and easy to use to specific audiences. For example, it may turn out that people from different geographical regions have different payment preferences.
Also, analyze the mobile version of your website. 50% of smartphone users are more likely to use a company’s site when browsing or shopping on a smartphone and avoid downloading an app. By knowing what kind of devices and operating systems they are using, you can create solutions to meet mobile users’ unique requirements and preferences.
If you want to learn more about audience targeting, read our article Audience targeting: how to successfully use a CDP
3. Page views, time on page and bounce rate
Page views and time on page are crucial quantitative metrics of your website. Firstly, you should verify which are your top most frequently visited pages. You can check that in the page’s analytics report. Keep in mind that just because a page is visited frequently doesn’t necessarily mean it is also performing well.
Secondly, verify the average length of time a user spends on your website, since it reflects how informative and relevant the website is. Average session duration can be key in analyzing behavior patterns of your audience but also in discovering UX problems.
You want users to be on each page long enough to gain the necessary information and encourage them to take the next step towards conversion. To make that happen you could, for example, make it easy to find the call-to-action (CTA) buttons taking visitors to another page. Or regularly add some interesting blog entries sparking visitors’ interest in your company’s news and encouraging them to sign up for your newsletter.
Also, watch out for other metrics, such as bounce rate. Let’s say, for example, that users are quickly bouncing off your website. Many factors could be responsible for that. Visitors might have left because the content wasn’t valuable enough, load time was too long or the interface was not user-friendly.
pro tip
It’s worth checking page speed, which will show you the average page generation time. This is important because the first five seconds of page-load time have the highest impact on conversion rates. As a 2019 study found, website conversion rates drop by an average of 4.42% with each additional second of load time.
Finally, do some tests, experiment, enhance the page experience and you will surely improve those metrics.
4. Event tracking
Event tracking is an advanced yet invaluable feature that allows you to record interactions with the elements of your website which aren’t tracked as standard within an analytics platform.
You can use event tracking to test whether an update in content targeted at a specific audience was effective and improves engagement. Event tracking data will show you whether the buttons, forms, and downloads are working the way you intended them to work.
Actions on your website that can be recorded with event tracking:
- clicking on non-clickable and clickable elements
- using video and audio players
- exiting a page
- filling out a form without submitting it
- downloading PDFs or other resources
- scrolling
If you want to learn more about event tracking, we recommend you check out this exhaustive blog post: Ultimate guide to Piwik PRO event tracking
5. Conversion rate
Events that are important to your business should be tracked as conversions. A goal conversion happens when your visitors complete a specific action you want them to take on your website.
The goals may vary from page to page. For instance, a goal for a page that displays a range of SaaS products will be to convince users to start a trial. But, a goal for a blog of the very same company will be to raise brand awarness by reading an article.
It is significant to match conversion to traffic sources, as doing so will allow you to correctly optimize your advertising channels and direct spend. You can check this in the acquisition report we’ve mentioned, by looking at the source/medium. Here you can analyze the traffic sources that drive the most conversions.
Some conversion examples:
- signing up to receive an email newsletter
- downloading a guide, whitepaper or e-book
- completing a contact form
- requesting a demo
- a full sale or purchase
Read more about conversion issues in: Finding website conversion problems with cross-device/browser beports
6. User flow and pathways
The user flow report presents the pathways users take when browsing your website. Those paths show what pages users visited and in what sequence. This is a great way to see how users move through your website.
User flow reports give you information about pages:
- on which users enter your website
- on your website they visit next
- on which they decide to leave
A good practice is to check a page with high conversions and look at what pathways brought your users to that end. What’s more, by comparing the actual paths with the desired ones, you’ll be able to see some gaps you might need to fill.
Do you want to learn more about user flow? Check out our other posts
3 reports for optimizing user flow on your website
7. Funnels
Funnels let you trace customer paths and identify bottlenecks. You can also see if changes you introduce to your website are increasing conversions.
To set up a funnel report, you’ll need to define a path you think people take to reach the goal.
Thanks to funnel analysis you can:
- identify the high-traffic, high-exit pages where people are leaving
- track the key steps of the user journey
Once you have built your funnels, you can check their performance. The visitor path is visualized step-by-step, and you can detect the step where people leave the funnel, see the conversion and drop off rates. You’ll see what’s working and where you can make improvements. It is a good idea to create multiple funnels to measure micro conversions and then take the necessary actions to improve conversion rates.
pro tip
After you’ve identified problematic high-exit pages and obstacles in your conversion funnel, you can take a more in-depth look at what users are interacting with right before they drop off by using heatmaps.
Read more about funnels in our article Funnels: Improve conversion rates and user experience
8. Heatmaps
If you want to boost your website’s user experience, looking at metrics like page views, acquisition, and conversion rates separately isn’t enough. And here enter heatmaps. They show you combined color-coded data on where and how often people clicked on a page, how far they scrolled, what they looked at or ignored.
Collecting such information gives you valuable insights about your visitors’ engagement and lets you better measure UX.
How to use heat maps? Imagine you are applying a web analytics platform to analyze traffic, but you need a full picture of how people are interacting with the website. You want to optimize your homepage for sign-ups and improve conversion rates but don’t know where to start.
The heatmap analysis shows you the spots on your homepage where people clicked, and it indicates that people are interacting with various page elements more than with the call to action. This may be the source of your problem, so you decide to use a bigger CTA button. Then, you test it for a while and it turns out it works magic — the conversion rate goes up.
9. 404 pages report
If you’ve ever encountered a 404 error, it surely wasn’t a pleasant experience, and you can imagine it wouldn’t be pleasant for your website’s users. Some companies try to be creative in tackling 404 pages. They use funny pictures or slogans that reduce frustration.
You should keep track of 404 errors to make sure you avoid them in the future because:
- errors create a bad user experience that causes people to leave your website and can decrease conversion rates
- multiple recurring errors have a negative impact on your SEO
There are a few causes of 404 pages, for instance, the user misspelled the URL, the page has been moved or deleted, or the URL was linked incorrectly. Thanks to web analytics you can track and monitor 404 error or ‘page not found’ on your website. They will also help you spot broken links on your website.
10. Page load time
Page load time is important as it affects both UX and search engine rankings. Additionally, the first five seconds of page load time have the highest impact on conversion rates.
Web analytics software can generate detailed and page-specific reports on page speed. You can even view page load times by browser and country, which is surely useful for global brands. The page load time report shows a page and its average generation time. You may also see this data per channel, device type and model.
Most common causes of low loading speed:
- poorly coded third-party widgets
- not leveraging browser caching
- not minifying CSS & JavaScript code
- not configuring a viewport for mobile devices
- too many images and videos
- too many JavaScript and CSS Files
If your page load speed is sluggish, consider optimizing the images or compressing your video files.
Conclusion
Good user experience is one of the most critical factors contributing to the success of businesses with an online presence. That’s why it should be a key part of your strategy.
User experience is more than a nice website design. It covers all aspects of the user’s interaction with your company, its services or products. True UX is about meeting your users’ expectations and needs. Thus, it requires focusing on those visitors, understanding their behavior and preferences.
Improving user experience takes more than just a single tool to accomplish successfully. Web analytics is one of the vital tools in this process. It’s not only for measuring web traffic: it provides you with useful insights about visitors, conversions, bounce rate, and much more. With that data you can chisel your strategy to enhance your site, adjust it so it better serves your customers and convinces them to stay with your business for longer.
If you want to learn more about web analytics, check out the following articles:
The post 10 things to consider for improving user experience with web analytics appeared first on Piwik PRO.
]]>The post 3 reports for optimizing user flow on your website appeared first on Piwik PRO.
]]>Well, users rarely take the path you’d like them to take. Instead, they often wander about in search of more information. They might even get bored midway and just exit your website or app without ever completing the goal.
This is especially true if a user enters a home page with lots of navigational options or a range of product categories. They might feel lost and need time to find what they’re looking for.
This is where you step in, to help your users reach their goals faster and more efficiently. In other words, to optimize user flow.
If you want to be their knight in shining armor, you shouldn’t go into this battle blind. Arm yourself with the best tool there is – solid data. You’ll find it in user flow reports.
What is user flow?
User flow reports give you a representation of:
- Pages on which users enter your website.
- Pages on your website they visit next.
- Pages on which they decide to leave.
This kind of analysis can be especially useful when optimizing:
- Visitors’ paths and funnels.
- Website’s navigational elements and menus (design, placement, copy).
- CTAs (design, copy).
By comparing the actual paths with the desired ones, you can make improvements to your website’s customer experience. The easier visitors can navigate through your site, the happier and more inclined to fulfil your conversion goals they’ll be.
To help you on this quest, we’ll show you three sample user flow reports that you can set up using Piwik PRO Analytics Suite.
What you should know about user flow reports
User flow reporting in Piwik PRO is relatively easy to configure, but at the same gives you room for advanced customizations. Working with it, you’ll be able to take advantage of the following features and options:
1) Three settings that help you analyze visitor paths:
- Standard: shows you the next interactions after the key interaction.
- Transitions: illustrates the interactions before and after the key interaction.
- Reversed: shows you the interactions preceding the key interaction.
Each of them will prove helpful in different situations – we’ll showcase their capabilities in the next section.
2) You can set up a user flow report for interactions such as a page view, download, search, custom event, and more:
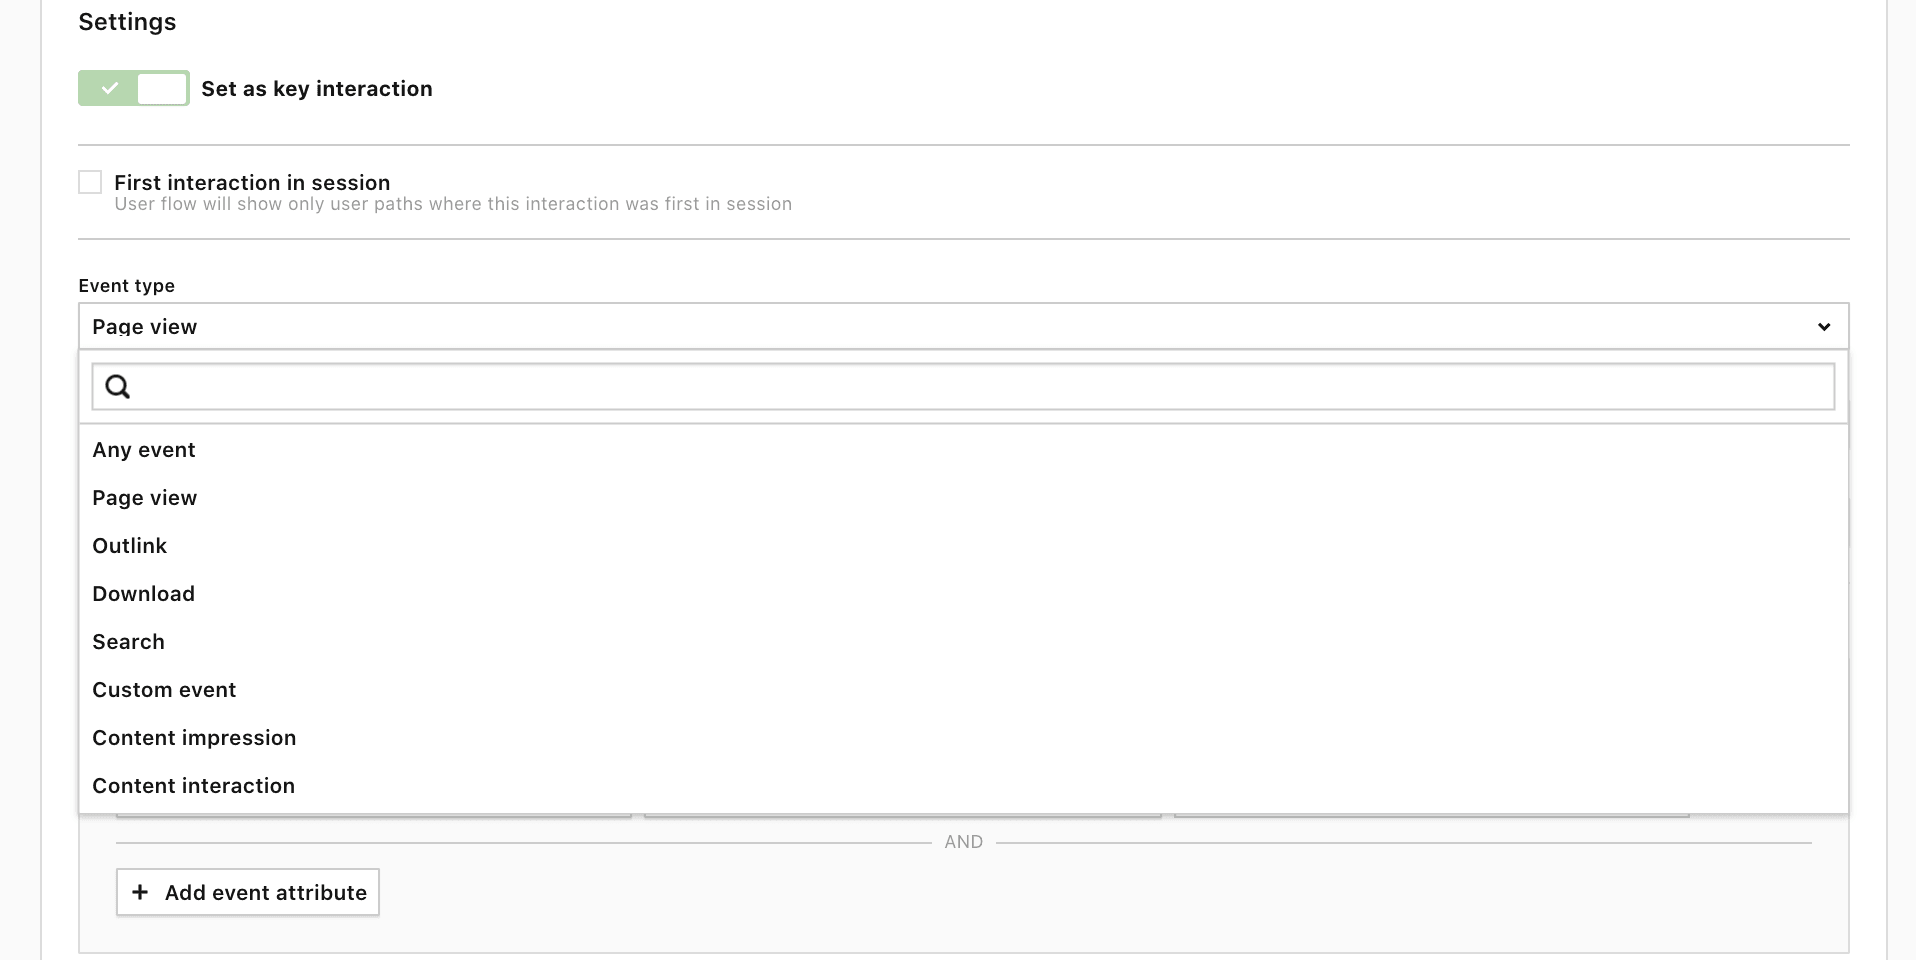
3) For each report, you can view a breakdown of dimensions related to sessions for the key interaction. For example, you can view channels, referrers, campaigns, and more:
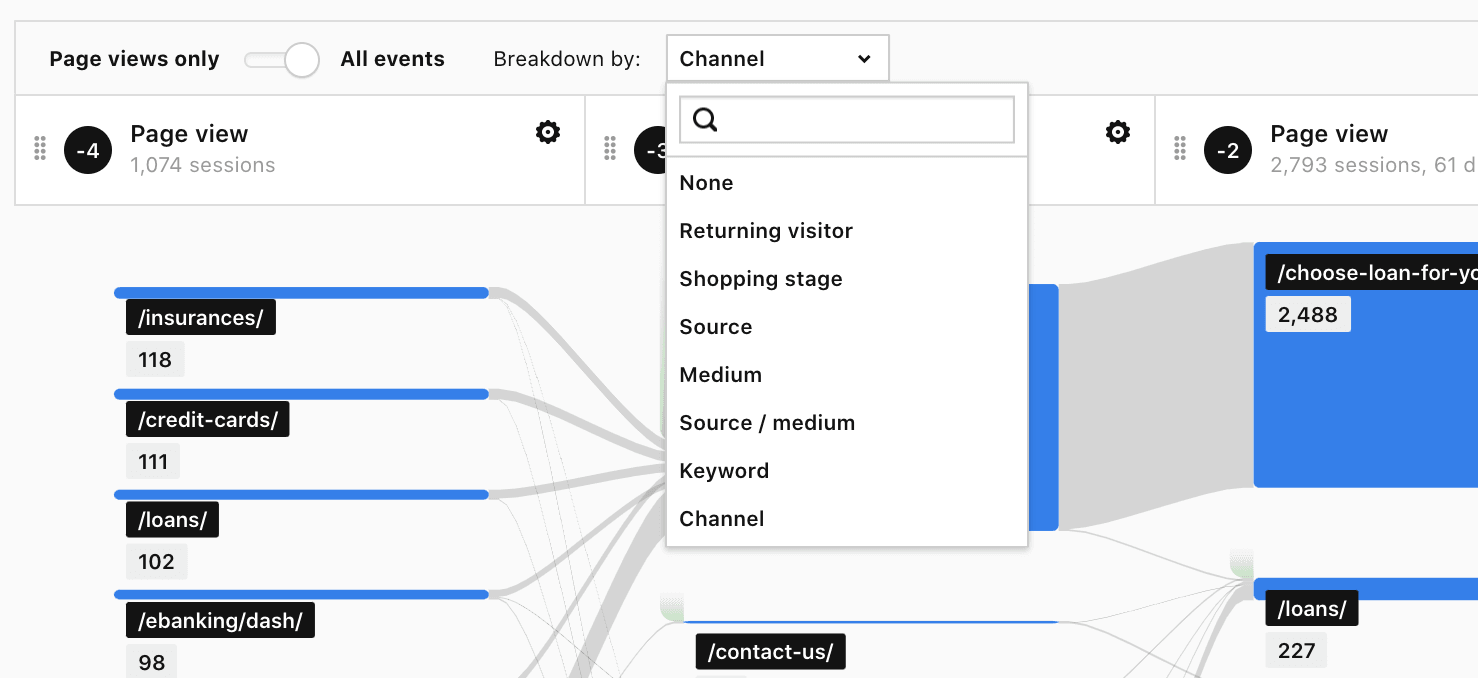
4) Every interaction in the flow can be filtered based on the type of event picked for that given interaction, e.g. if you choose a page view then you can filter it based on page view attributes:
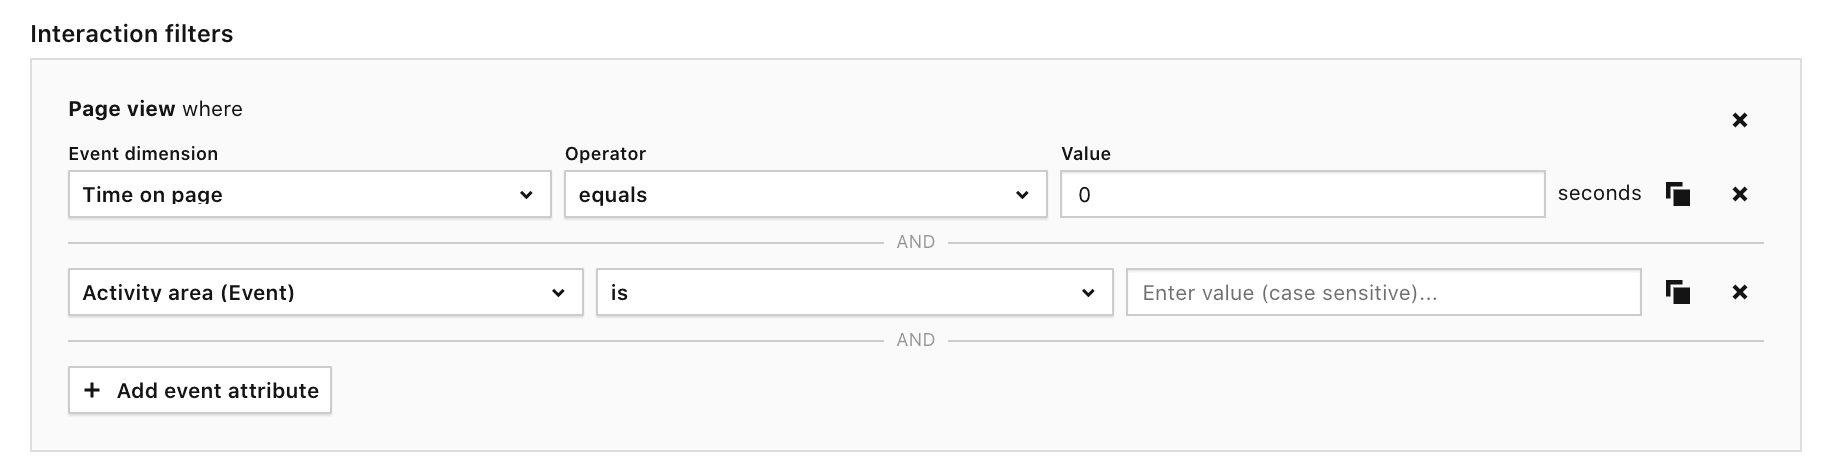
5) For each report, you can view a highlighted path that visitors use most often (you can also highlight such paths for each element available in each interaction):
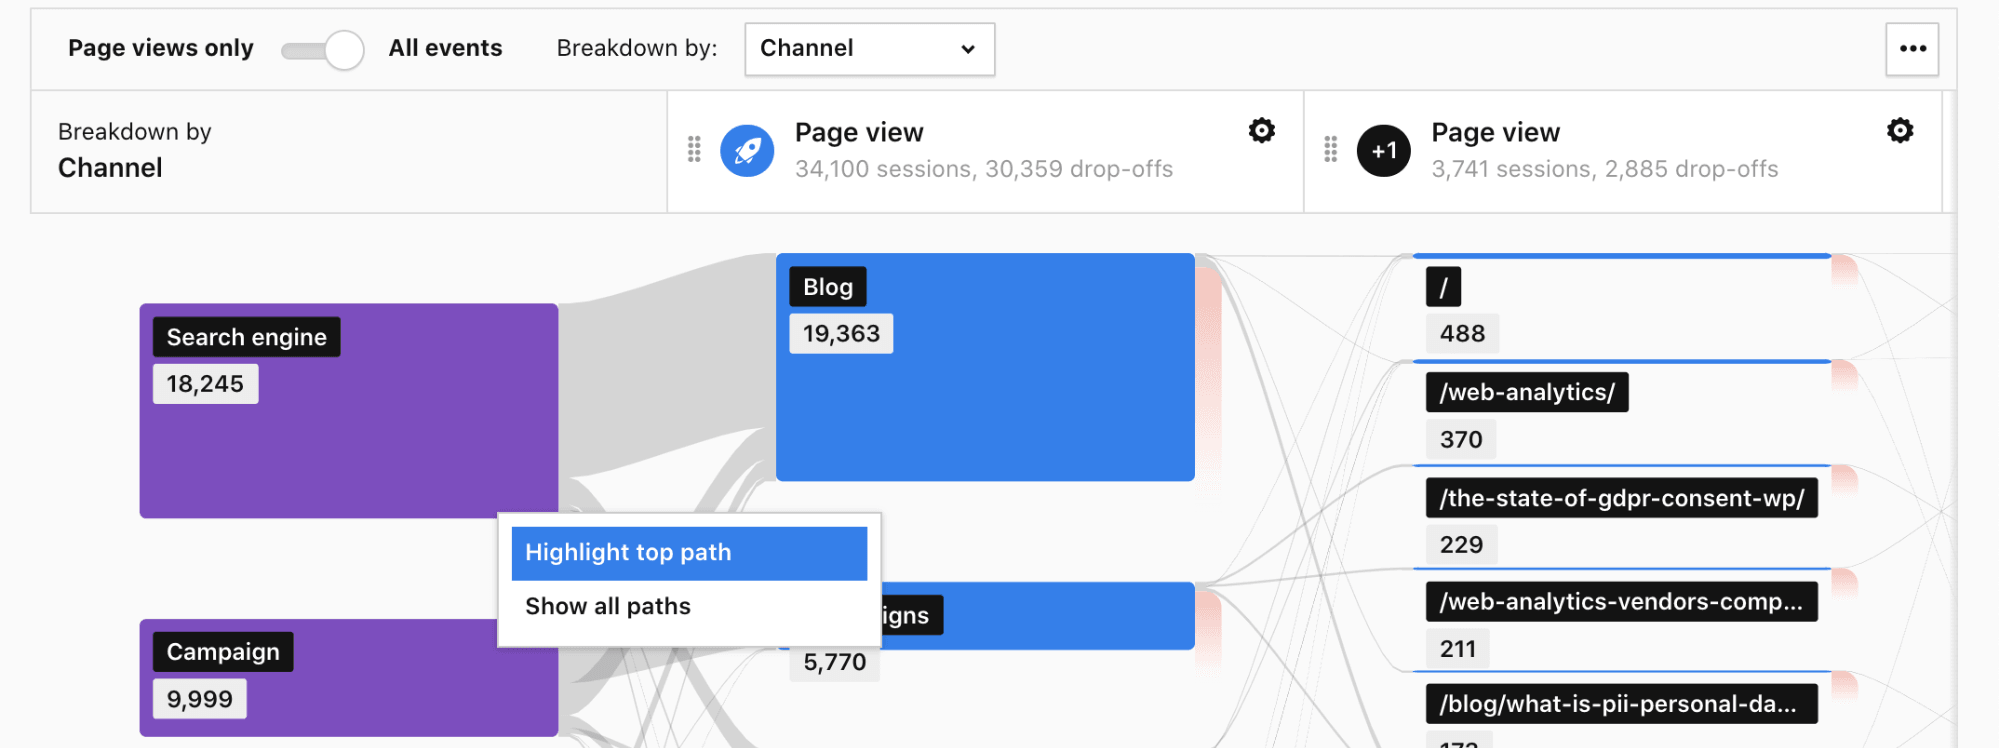
6) You can choose from visibility options Author or All users. With the All users option, you’ll be able to share your report with other teammates:
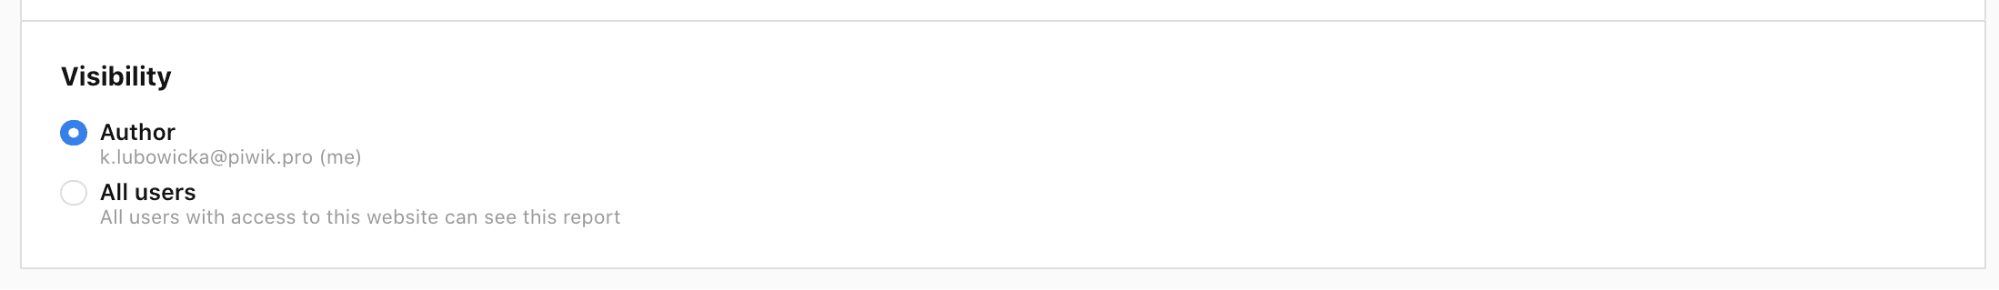
All this makes Piwik PRO’s user flow reports really flexible in the way they adapt to specific use cases.
Tip: User flow is also a built-in feature of every standard and custom report based on URLs, download URLs, and search keywords. You’ll find them under the blue icon with three arrows:
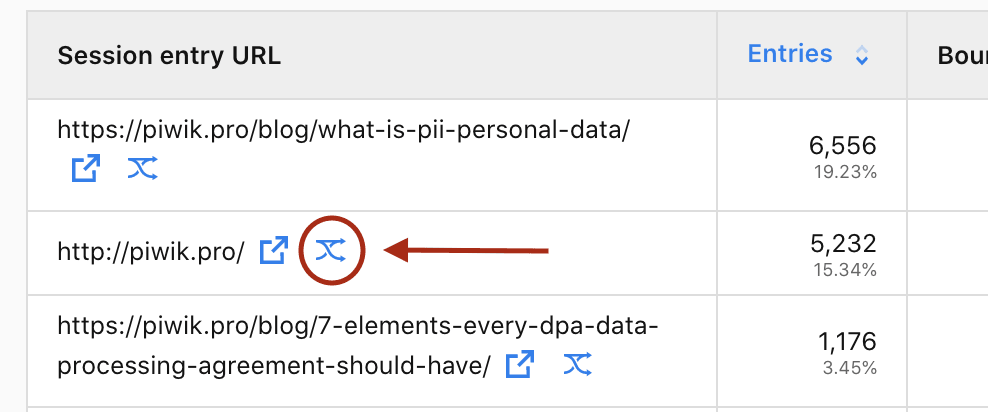
Using this functionality, you’ll be able to access the information about one step that preceded the visit on the site in question and one that followed it:
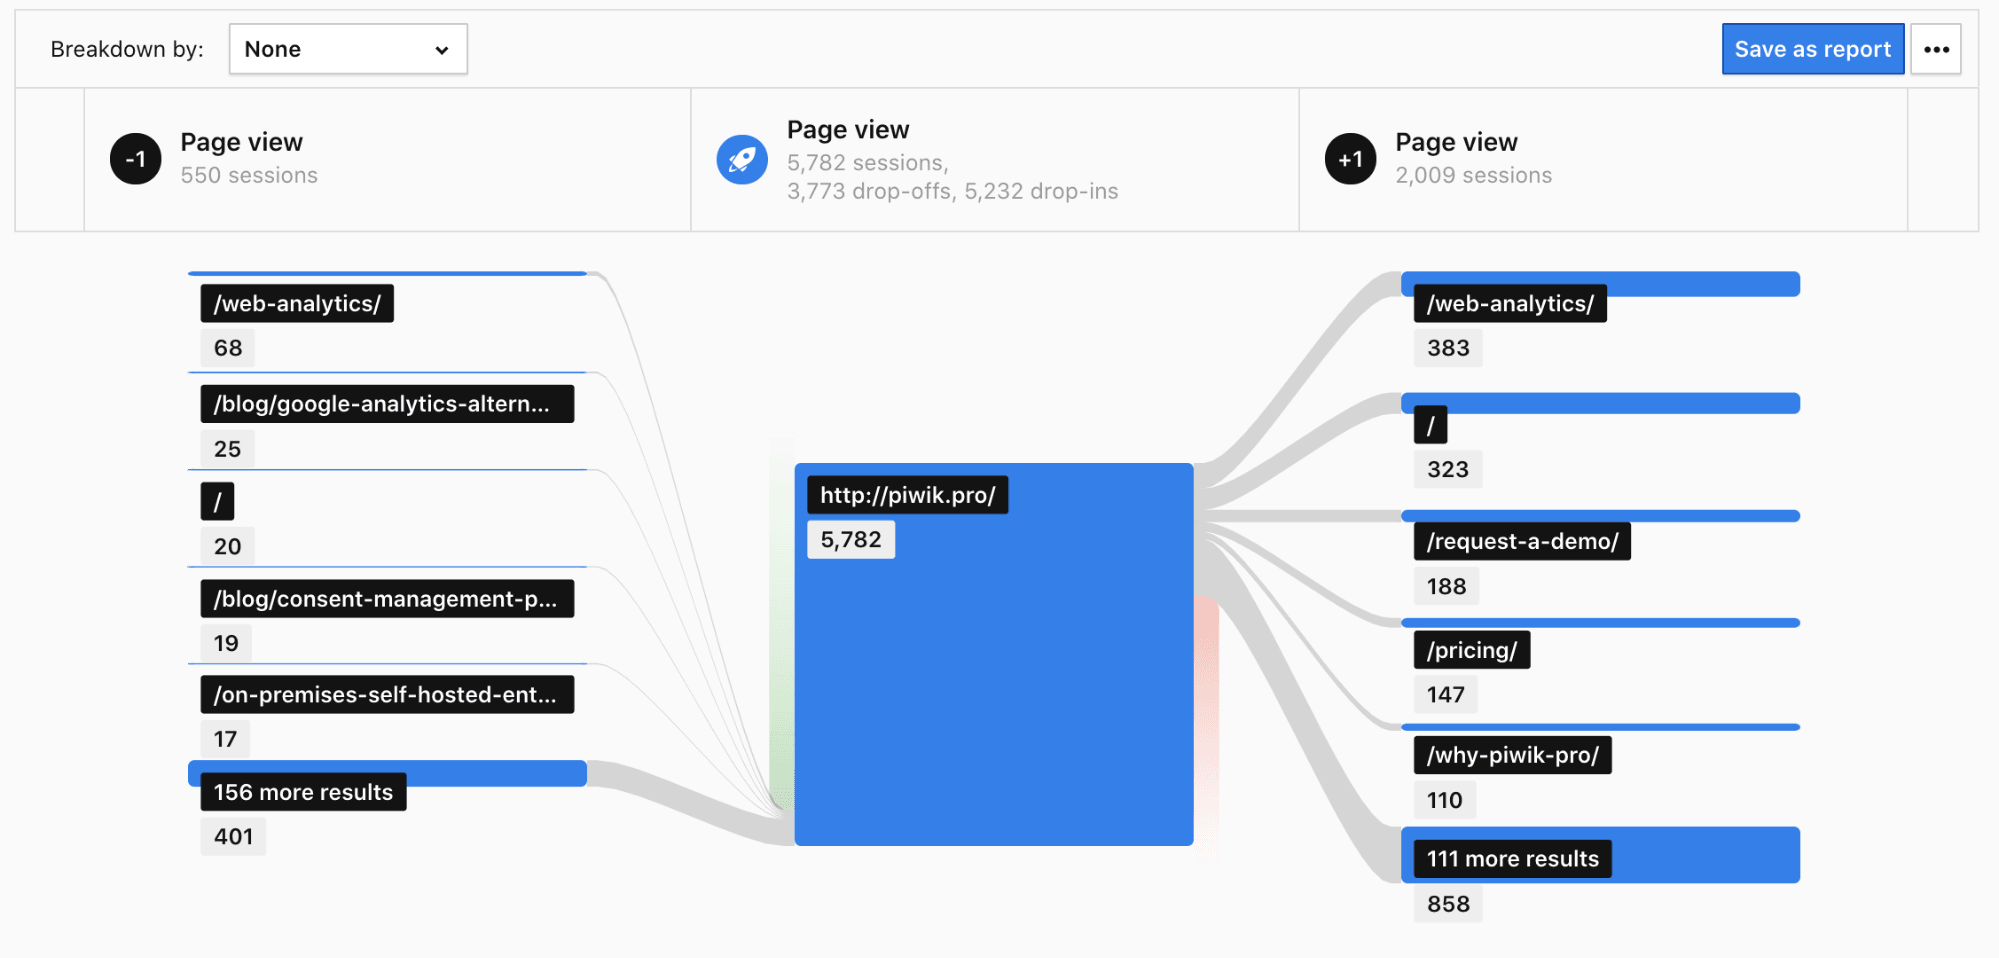
Quite handy, right?
The same report can be created once you are inside a user flow report. Each of the nodes within the steps can also have such a report.
Below we will show you some real-life applications of our reports with the use of our demo instances dedicated to healthcare, banking, and SharePoint analytics use cases. There, we’ll focus on the three main settings of the reports – standard, reversed, and transition.
Standard user flow – measuring effectiveness of your marketing campaigns
Let’s say you’re operating in the banking sector. You’re running two marketing campaigns: spring and winter. They are focused around three key products in your company’s offer – loans, insurance, and credit cards.
You want to know if your campaigns are bringing valuable traffic to your website. Namely – if the visitors arriving to your website from the ads end up buying your products.
To do so, you could use a regular user flow that starts with key interaction filtered by the product pages (Loans, Insurance, and Credit cards) and broken down by the campaigns’ names. That will allow you to narrow down the results to the data relevant in this context.
Here you can find a tutorial on how to set up a standard user flow in Piwik PRO:
This content is hosted by a third party (YouTube). By clicking the button below, you consent to loading the video.
Here’s the finished report:
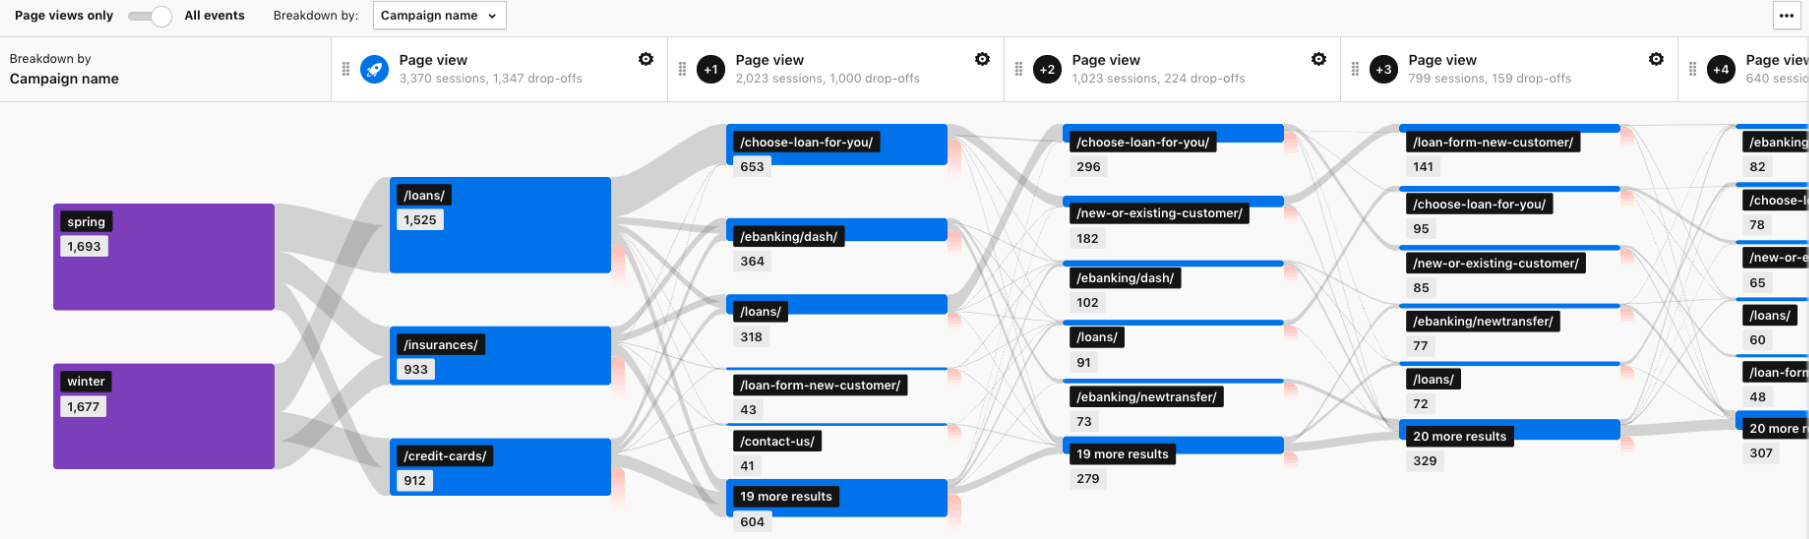
What you can see is that for people who landed on the “Loan” page, the most common path is to interact with the loan calculator located under /choose-loan-for-you/ URL and then to apply for the loan:
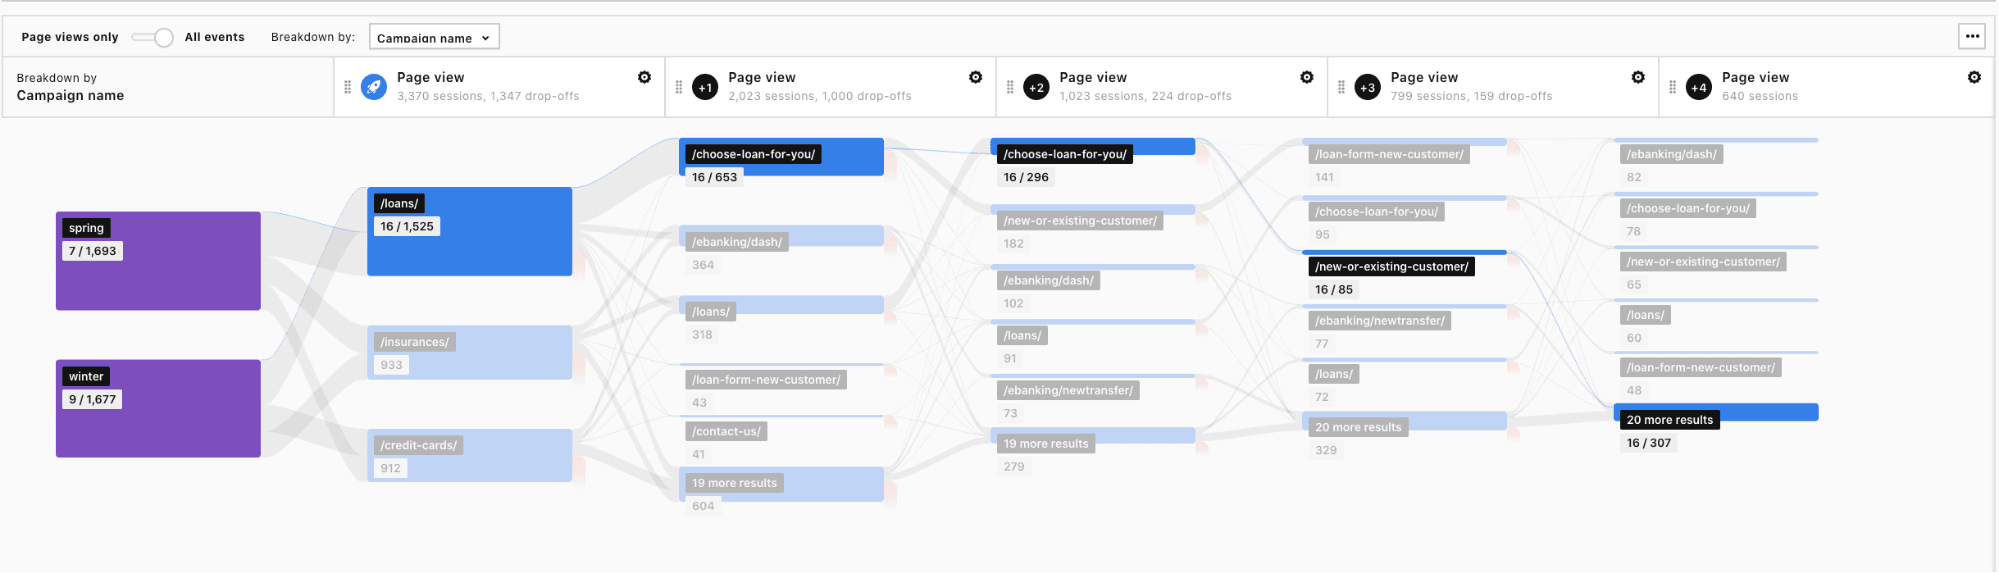
With other, less popular products, the user flow is split between the two most frequent scenarios:
- Visitors switch their interest to pages related to loans.
- Visitors log in to their e-banking platforms.
If you’d like to dig deeper you could segment your users and investigate i.e.:
- If your ads and website are optimized for mobile visitors.
- What paths are followed by visitors with different browsers and operating systems.
This information, paired with a diligent review of your ads and the pages visitors land on next, may show you if your content resonates with targeted audiences. It can also reveal UX issues that cause visitors to exit the website or search for the desired information in unexpected places.
Reversed user flow – finding out how visitors reach a certain website
Now, imagine that you’re a healthcare provider. In the upper right corner of your website there is a button that takes users to the page where they can book a doctor’s appointment:

You would like to know what content they consume before they hit the button and schedule a consultation with a specialist.
To do so, you could use a reversed user flow that focuses on the key interaction – booking of the appointment by the visitor.
Here you can find a video tutorial on how to set up a reversed user flow:
This content is hosted by a third party (YouTube). By clicking the button below, you consent to loading the video.
The finished report would look like this:
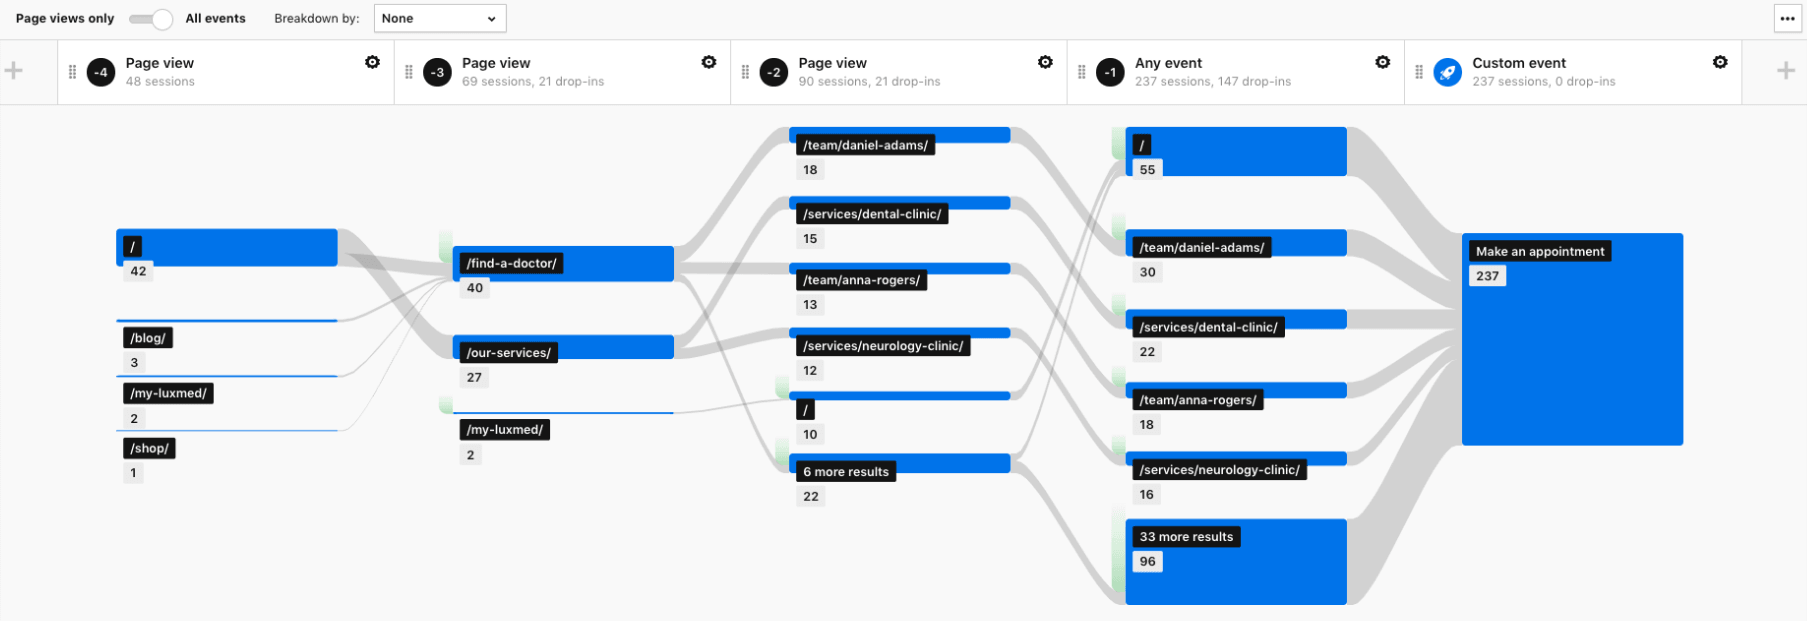
As you can see, in this case the key interaction is an event – a click on the Make an appointment button. The key interaction is preceded by the two most popular paths:
1) Visiting the Find a doctor page – this scenario takes the user across the main page where they can read about available doctors, through pages about specific doctors, and finally to booking an appointment:
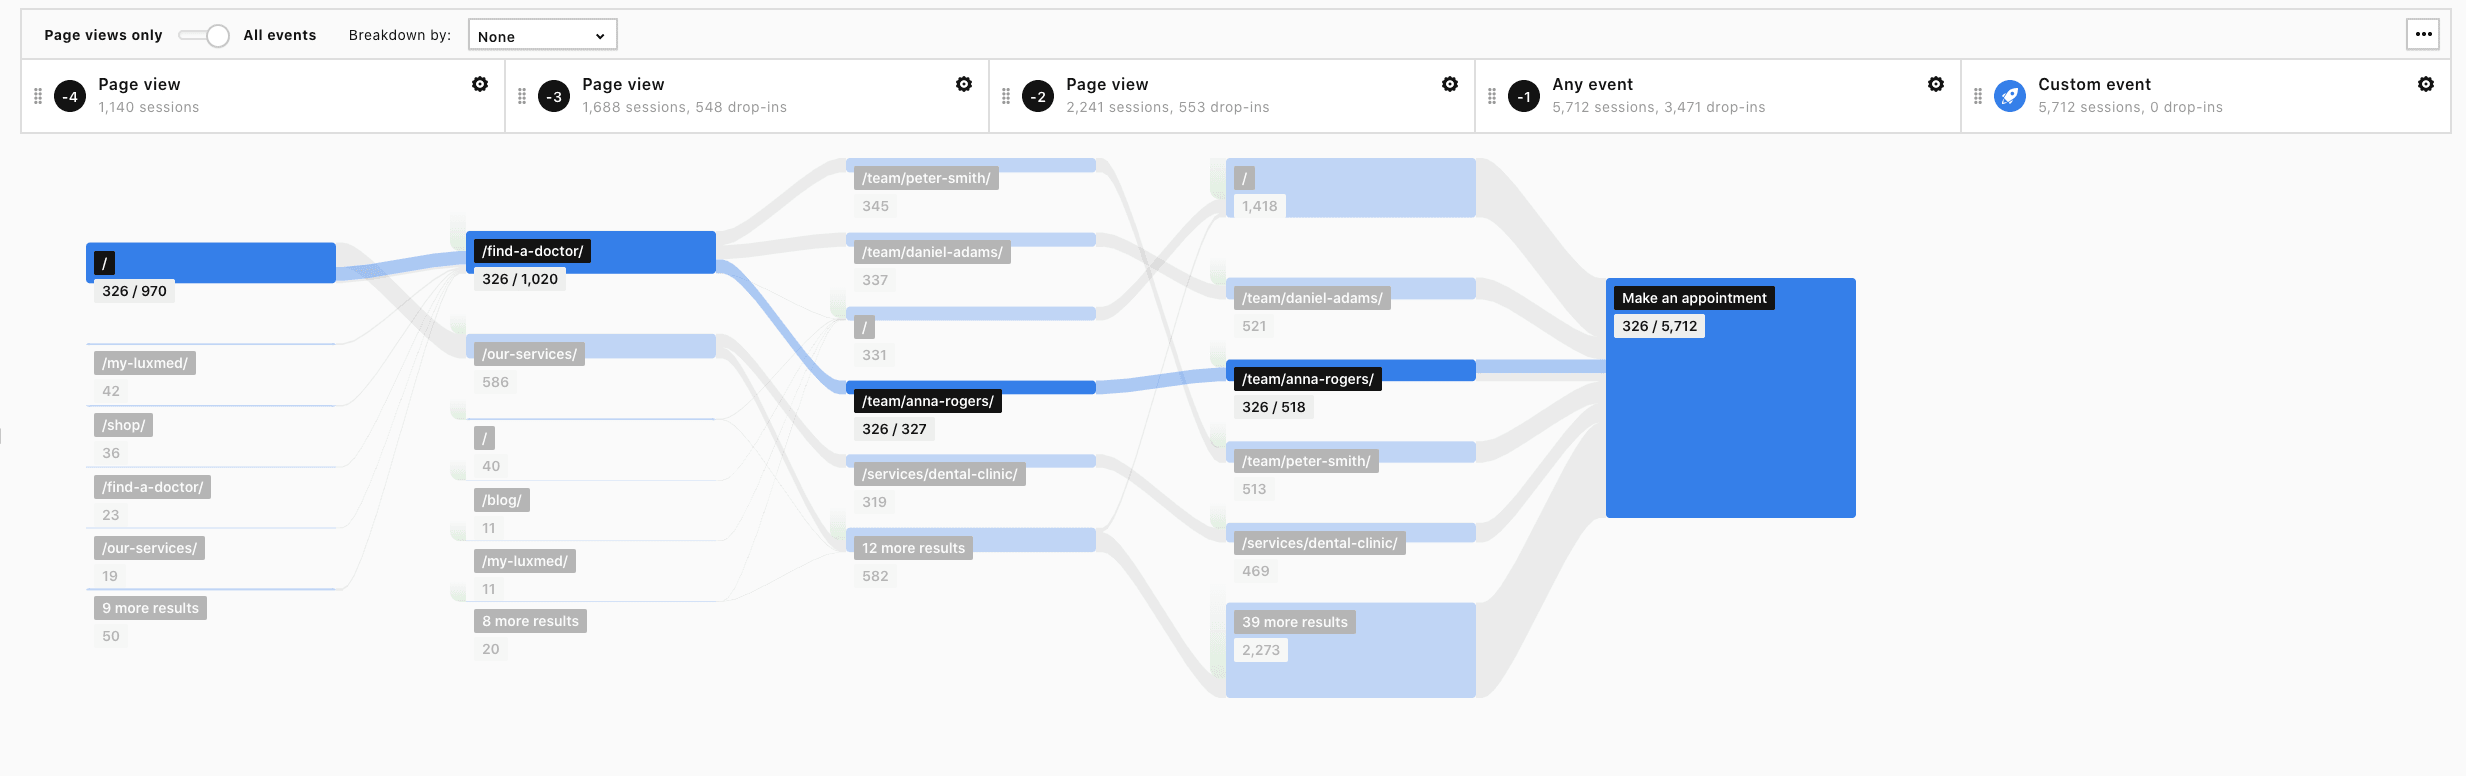
2) Visiting the Our services page – where users first get familiar with the pages that describe the specialities of the hospital’s clinics. Then some users read more about the specific doctors, and some move directly to the appointment booking process:
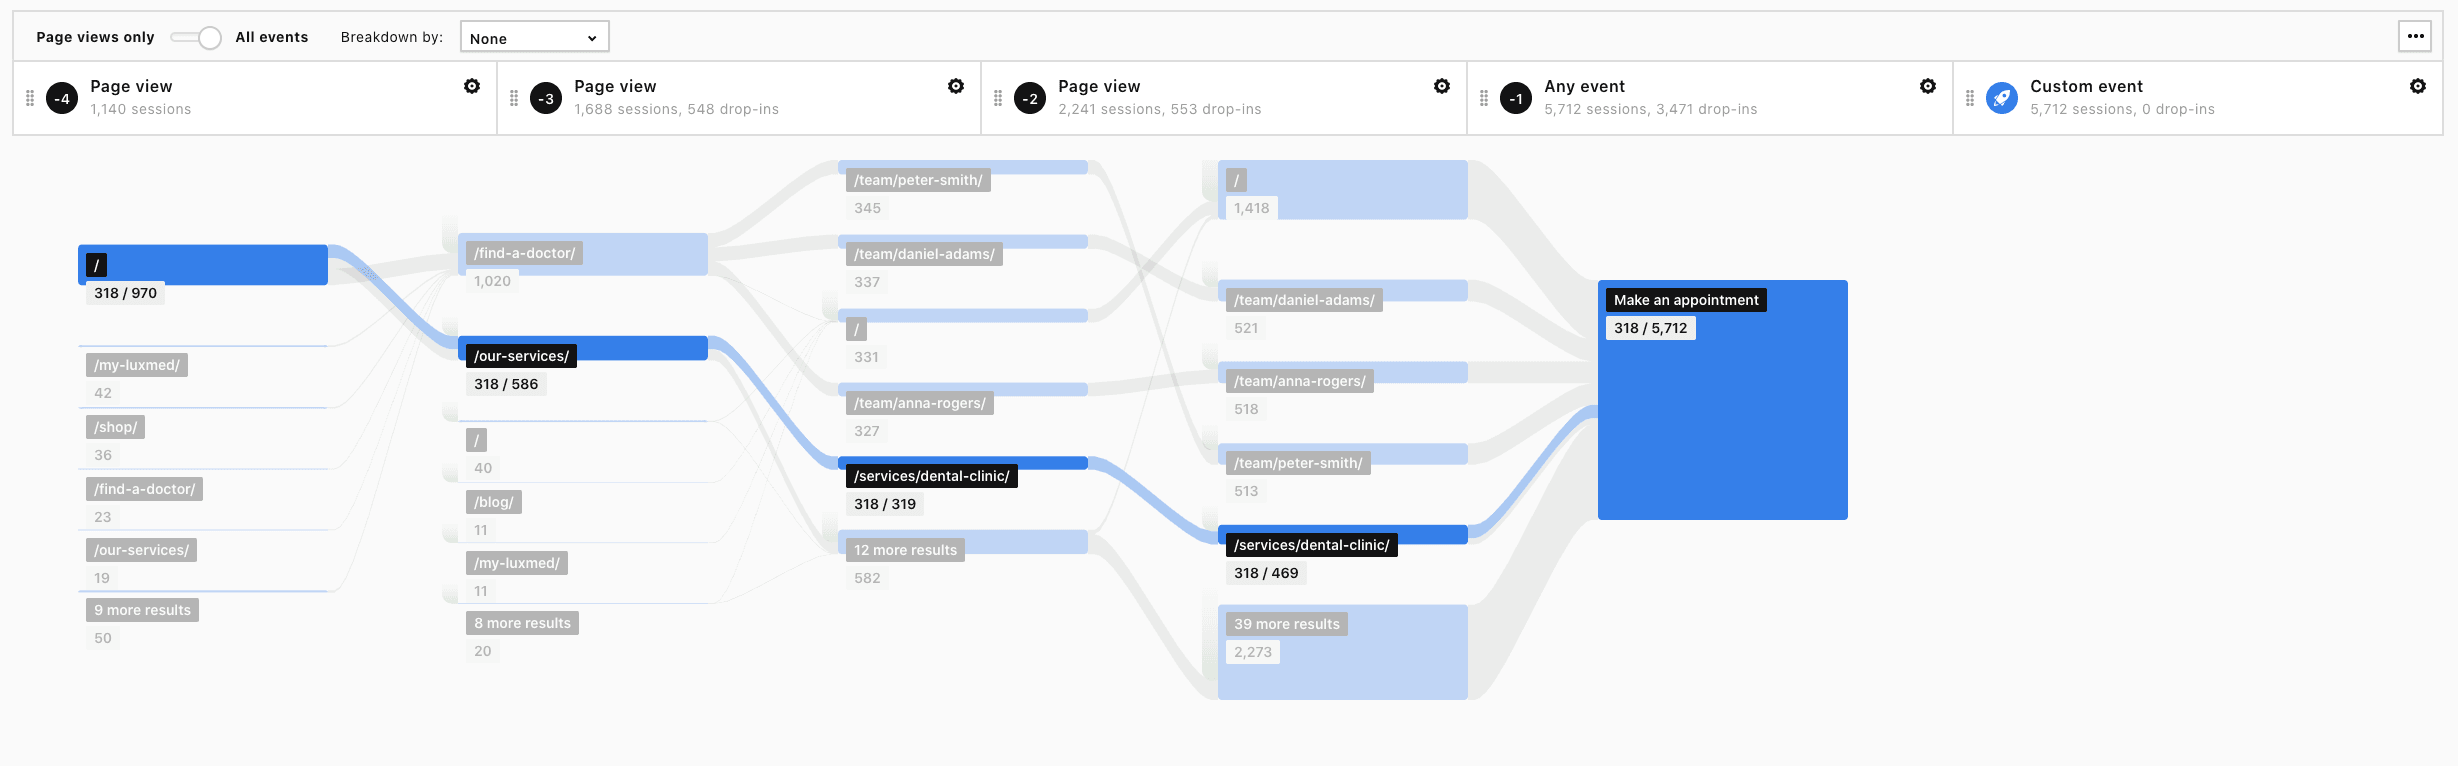
There is also an additional flow of a considerable group of users who book the appointment directly from the home page:
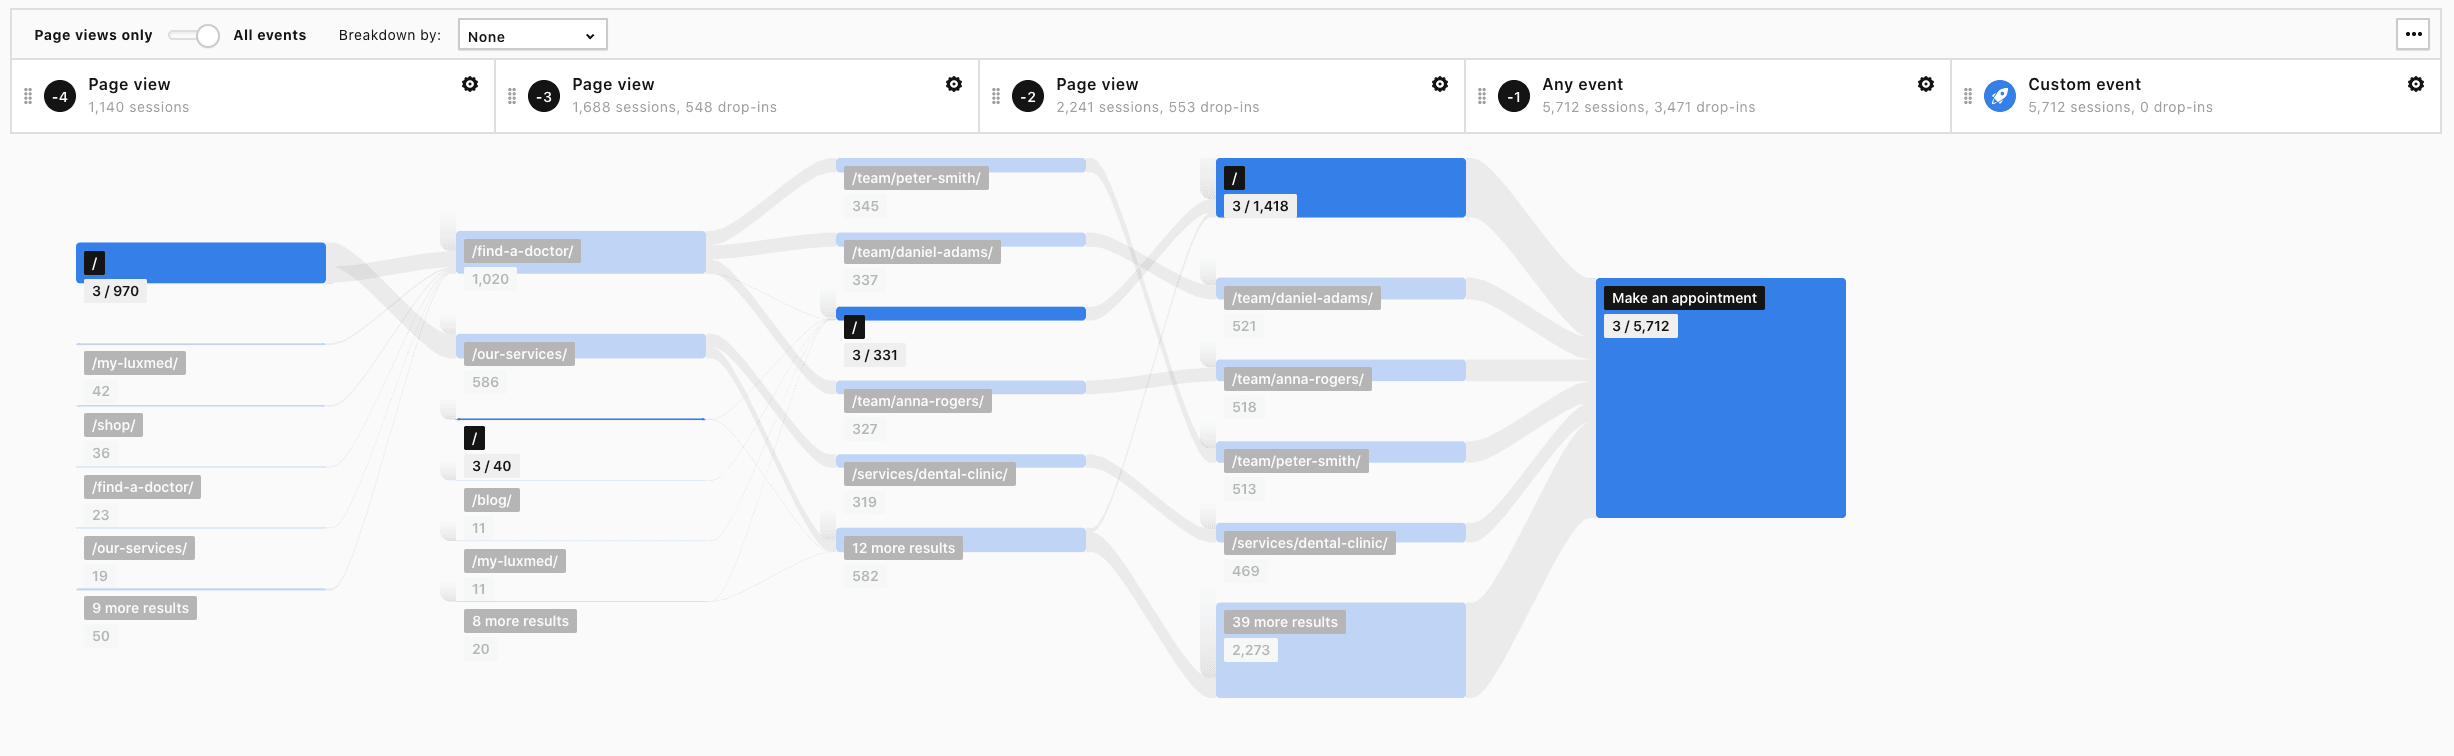
Tip: You can drill down into the data by using the Breakdown by feature, segmenting your visitors or applying additional filters. This way, you’ll be able to analyze the behavior of users with different devices and operating systems, or those coming from different channels, and spot more potential issues.
Read this blog post if you’d like to learn more about how Piwik PRO can help you enhance patients’ digital journey: Improve consumer experience in healthcare with analytics and personalization: 3 powerful use cases.
Transitions user flow – analyzing how employees use SharePoint’s internal search and what pages they visit next
Finally, let’s discuss a sample application of the transitional user flow report.
For this purpose, let’s assume that you want to know if the content of your intranet space is well optimized for internal searches. You’d like to make sure that everyone using SharePoint is able to find the information they’re looking for.
In this case, you could leverage the capabilities of the transitions user flow report with one additional step before the search takes place (so you know where visitors are when they decide to look for information using certain keywords).
The key interaction could be set to group the user interactions by the search keyword. You can also group it by the page URL dimension, which will reveal where the search occurs.
Here you can find a tutorial on how to set up a transition user flow:
This content is hosted by a third party (YouTube). By clicking the button below, you consent to loading the video.
On the finished report, you see how users navigate across the website after using the search.
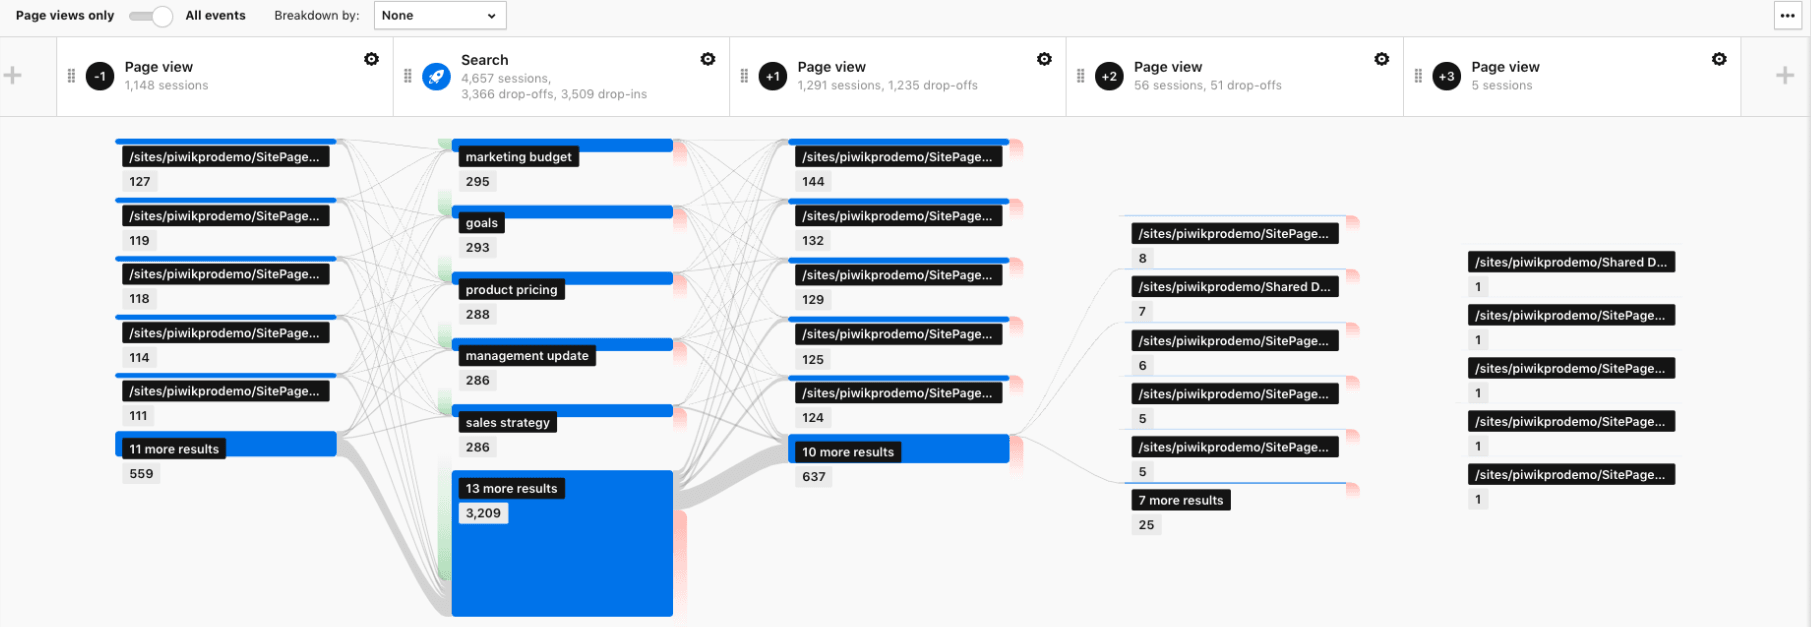
This allows you to analyze the most popular searches and the paths that follow them in one view.
Among other things, you can check if:
- The navigation of your intranet space is intuitional for users.
- The content related to the topics your employees are interested in is easy to find.
- The intranet space lacks any relevant piece of information.
If you’d like to learn more about tracking SharePoint with Piwik PRO, be sure to visit this page.
Final thoughts
Optimizing user flow is a process that involves multiple techniques and tweaks along the way. Visitors can move around your website in mysterious ways, so if you really want to help them reach their goals you need to rely on cold, hard data.
We hope that our examples will help improve your users’ journey. We would also like to let you know that these are just a few of the many applications of our user flow reports.
If you’d like to learn more about this topic or about other scenarios where these reports can prove useful, you can always reach out to us. We’ll be happy to answer all your questions.
The post 3 reports for optimizing user flow on your website appeared first on Piwik PRO.
]]>The post 7 Areas to Consider to Improve a Digital Bank Account Opening Process appeared first on Piwik PRO.
]]>Still, the abandonment rate for opening online accounts is 19%, as we learn from the Digital Banking Report. Another study, by Signicat, reveals that as many as 40% of online applications never get completed. So there’s obviously room for improvement and new opportunities. Most importantly, you need to grasp why so many people struggle to complete this task.
One of the biggest culprits is that the process is often confusing and requires a lot of work from customers. According to research by CEB (now Gartner), 96% of customers who put a considerable effort into an interaction become more disloyal. That’s why you need to ensure the procedure is smooth and simple from end to end, whether on a desktop or mobile.
For financial institutions, the challenge is even greater. People expect an experience as simple and pleasing as from apps like Uber or Airbnb. Above all, it needs to be fast and intuitive. The thing is, these applications don’t have to deal with the same legal and compliance issues as banks do.
But with the right technology, like analytics, and a sound strategy banks can streamline the process so people can open accounts with just a few clicks. Today we’ll present the key considerations that will help you reach this goal.
1. Legal and technical stumbling blocks to overcome
If you’re looking to optimize the procedure for opening a bank account, you need data. And there’s a wealth of it to be collected, since each step of the operation involves multiple forms containing personal and frequently sensitive data. This, in turn, entails an obligation to meet various regulations and have appropriate security measures in place.
Learn more about different kinds of data by checking out our posts:
From a technical standpoint, you need to be sure that your software provides your organization with the utmost security and full control over your data. As a bank, you operate within strict protocols and policies that specify who can access certain data you gather.
In that case, you can’t rely on solely cloud-based software like, for instance, Google Analytics. What’s more, not every vendor offers the highest standards of data protection.
The most airtight solution would be on-premises analytics that complies with stringent security and legal policies inside the bank. Self-hosting deployment allows you to supervise the application. That means you know where your data is sent – into your own servers, kept under your watchful eyes.
Also, you get full access control, so you’re in charge of your infrastructure configuration. You can tailor it according to your bank’s security rules.
If you want to compare different hosting options and see which one would best suit your needs, check out:
How to host your analytics: public cloud vs private cloud vs self-hosted
However, internal rules are just a part of the story. Besides internal regulations, you need to consider the legal landscape. With growing awareness of user privacy and data security issues, there’s more than just GDPR to think about. For example, there’s the California Consumer Privacy Act, Brazilian General Data Protection Law (LGPD), Chile Privacy Bill Initiative, and China Internet Security Law.
The good news is that if you have adopted a GDPR-aligned framework across your bank, then compliance with other laws will be much smoother. In some cases it might even mean you’ve done most of the heavy lifting already.
Dive deeper into privacy laws around the globe and check out our posts:
2. Defining business requirements
For banks, credit unions and other financial organizations, reducing frictions in the process entails designing a sound strategy. That involves specifying business requirements, determining what needs to be measured to optimize each step.
Start small and consider basic UX metrics that will give you the bigger picture, like:
- conversion rate
- process success rate
- abandonment rate at each step of the process
- the average time it takes to open an account
For instance, abandonment rates are most acute when people are going through online identity verification.
Once you grasp the state of affairs, you can dig deeper. After UX and analytics metrics, focus on business metrics. There are certain things you need to analyze. For example, think how each change to the process of opening an account impacts its quality. Or whether a drop in the number of accounts opened correlates with an increase in their business value.
To get a broader perspective on collecting business requirements, take a look at:
10 Steps to Gather Business Requirements for a Robust Web Analytics Strategy
3. Preparing an implementation plan
After you have requirements and goals in place, the next step is to convert them into an implementation plan. This is the ideal tool to ensure you’re tracking all key interactions during the account opening process. It also covers resources, budget, outcomes and responsibilities. Finally, it serves as a technical guide that turns business needs into tasks for developers and technical teams.
Such plan transforms goals and ideas into identifiable steps, ensures you keep a record of all your activities so you won’t miss anything that’s crucial for the success of your business initiative.
To learn more about analytics implementation, we recommend reading:
Analytics Implementation in 12 Steps: An Exhaustive Guide (Tracking Plan Included!)
4. Spotting the friction points
To improve the process of opening accounts, you need to find where and why people struggle with it, or even abandon their efforts. It’s best to reach for basic but fundamental reports that help you understand user flow. Go for funnel visualization reports.
Read up on user flow:
3 Reports for Optimizing User Flow on Your Website
First, you need to segment data in the report and then break it into smaller chunks. Then, start to measure conversion and abandonment rates for the whole process as well as for individual steps. This data shows you the process’s breaking point faster.
With a properly configured report and attached metrics, you’ve got a perfect set of KPIs to track the process. Also, you can monitor if your optimization strategy is moving you closer to your goals.
Funnel reporting lets you do a quick “technical analytics” and UX overview of the account opening process. The last piece of this puzzle is segmentation. You can divide your customers by:
- device type
- browser type
- device manufacturer
- screen resolutions
You can apply more segments, but this should be enough to uncover 80% of the most basic technical issues.
You should be looking for answers to questions like: which user segments have higher abandonment rates? Does it matter if they use Apple or Huawei? What is the difference in abandonment rates between desktop and mobile users? And so on.
What’s more, insights from technical analysis are great guidance for your QA team. For example, by comparing abandonment rates between MS Edge and Chrome, you can indicate where the QA team should look for tech issues and bugs.
Once you know whether a particular form or step is the culprit, you can dive deeper by applying more granular metrics. If your analysis reveals that a form is causing issues, then shift your focus there and analyze customers’ interactions field by field.
5. Looking for flaws in the account opening process
Before you move any further, determine whether a form is the troublemaker. Crunch the numbers – how many users have interacted with the form but eventually abandoned it, and how many of them didn’t even start. If either percentage is high, then it’s worth analyzing this customer segment separately.
For customer segments that didn’t even start filling out the form, check if the form displays properly. Another reason might be that it was way too long and complicated.
As for people who leave the form unfinished, you need to verify which exact field provokes them to drop it, and which other ones could be problematic later on. That calls for an advanced analysis.
To assist you in finding the culprit, here is a bunch of handy metrics from Formisimo, the industry leader in form analytics. Measure:
- How often people abandon or drop forms
- How many times people re-enter or correct field data
- Which fields are regularly ignored or left blank
- How many form submissions generate errors
- How long it takes to complete a form field (or the entire form)
Such metrics provide you with a complete picture of form issues. Once you identify the reasons why users are dropping out of the process, you can fix them on the spot and prevent further damage.
6. Time required for opening the account
The digitalization of banking services means that people expect to do business quickly and easily. The same goes for opening an account, and numerous surveys confirm that.
As found in the report titled State of the Digital Customer Journey, abandonment rates increase dramatically when the time to finish an application process increases.
Understanding this finding is crucial to optimize the whole process.
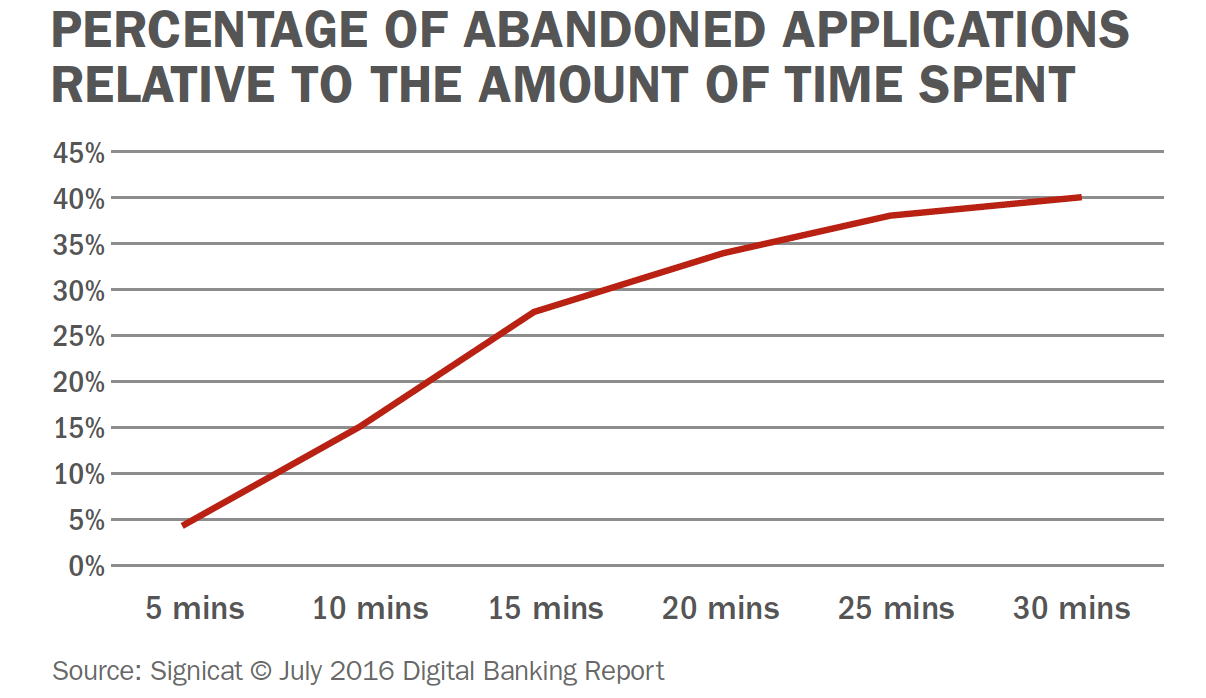
The numbers don’t lie. The Digital Banking Report reveals that barely 14% of organizations surveyed made it possible to finish the account opening process in not more than 5 minutes, while for 20% it takes over 10.
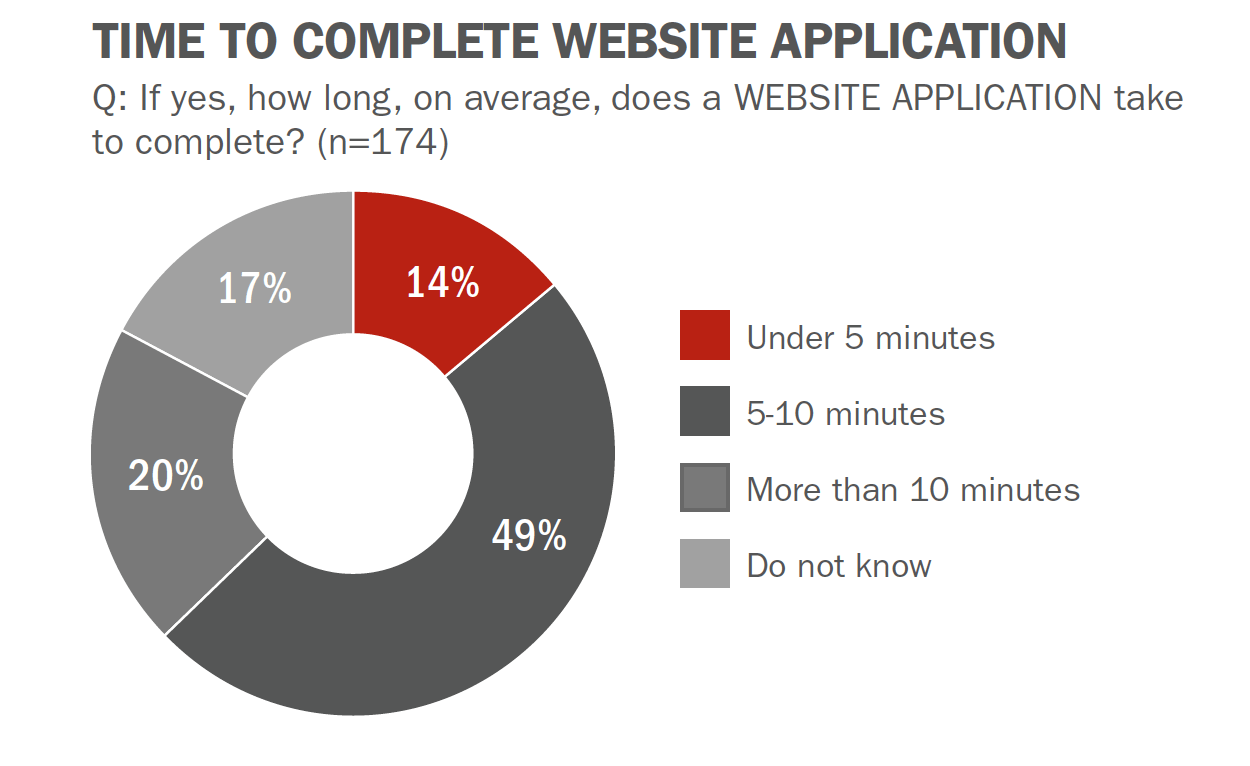
7. Optimizing opening a bank account for multiscreen experience
Mobile and online banking brings a host of challenges. The most critical of them is the account opening process – a dropped transaction can mean a customer is gone forever. Bad first experiences will destroy much of your efforts.
The problem is particularly acute for smartphones. Based on Avokas’s Digital Sales Report, more than 60% of digital applications in major national banks are sent via mobile phones. It means they have overtaken desktops. That’s why it’s essential to optimize the mobile experience when planning your acquisition strategy.
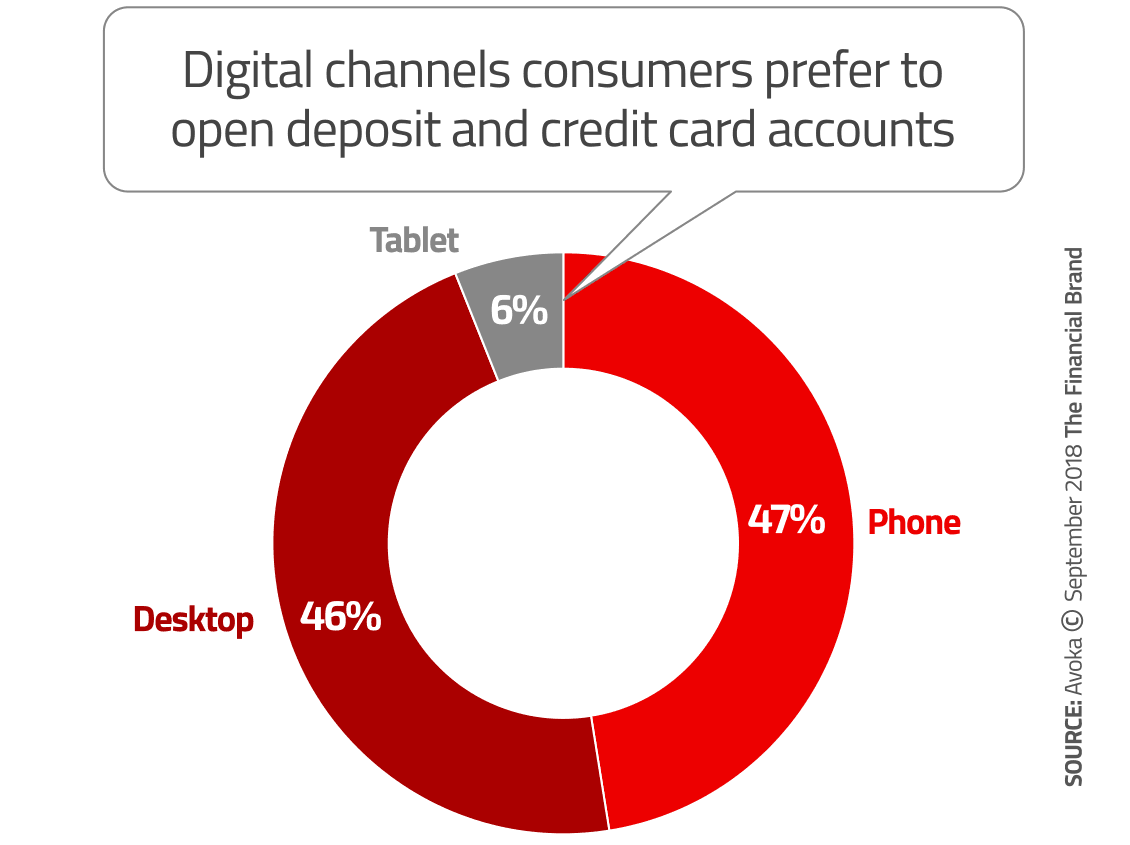
Moreover, streamlining the account opening process for mobiles is vital for Millennials, who top the mobile banking usage stats. They’re particularly demanding and show little patience for poor user experience.
In truth, as found in a survey by Jumio, 38% of Millennials drop mobile banking activities when things take too long. It turns out that improving the process, cutting down on time and removing frictions is a competitive necessity banks need to focus on.
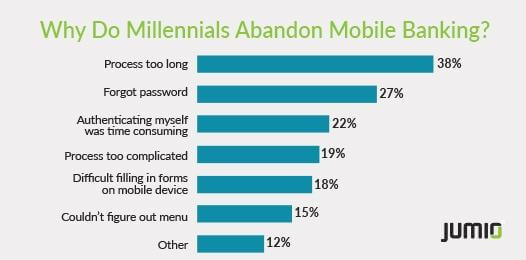
Best practices
Now that you know what you need to be looking for, it’s time for some actionable tips. To help you improve your overall strategy and save some time, we’ve gathered practical tips from the experts at The Financial Brand. Here we go:
- Simplify the form to the bare minimum. Make it fast and easy to complete. Ask only for the basic information that a person knows without checking any documents, like phone number or address. Any extra details you can gather later on. This helps you to reduce time, keystrokes and all unnecessary scrolling, which is a common issue on mobile devices.
- Make the process as digital as possible. Provide a way to submit documents via email or let users upload them online, support digital signatures so customers don’t need to visit a branch.
- Design with mobile in mind. A great experience on mobiles means a transaction is fast and doesn’t require much effort. Offer things like dropdown lists or toggle buttons so it’s easier for customers to supply information. Remember about reducing white space and including an adaptive design to ensure an excellent user experience across all kinds of mobile devices.
- Ensure “save and resume” functionality. While opening an account, customers often switch between channels so help them start the process and come back later without forcing them to take the same steps again.
- Retarget abandoned applications. People drop forms without completion for various reasons, be it low battery power, answering a call, or a lost internet connection. It’s crucial to obtain their primary contact information early in the process to retarget these applicants quickly.
- Postpone cross- and up-selling. First, focus on onboarding for the product your customer applied for. All marketing initiatives concerning additional services should wait until the account opening process is done.
- Ensure tool stability. Before you provide your prospects and customers with an app, make sure it’s free from glitches, bugs, etc. App failures and error notifications significantly impact user experience and unnecessarily extend the account opening process.
Final thoughts
Customers’ expectations are rising rapidly and a truly awesome digital experience across financial services is a must. That’s why long forms and complex account opening procedures need a serious makeover. Above all, banks and other financial players have to ensure the whole journey is 100% digital, and that it lasts much longer after clients activate their profile.
We hope that you will refer back to this article as you devise your optimization strategy. In case you want more details or have some questions about products you can use along the way, get in touch with us.
The post 7 Areas to Consider to Improve a Digital Bank Account Opening Process appeared first on Piwik PRO.
]]>The post Integrating your CDP with Ad Platforms for Customer Journeys that Convert appeared first on Piwik PRO.
]]>Charting the customer journey for your company gives you a roadmap that will serve as the foundation of your strategy. However, if you want to transform static roadmaps into customer journey-tracking powerhouses, you need a specialized tool with complex features, such as a customer data platform (CDP).
Customer data platforms are marketer-managed software that integrate multiple data sources to create a persistent database of unified customer profiles accessible to other systems.
The data can be used for, among others:
- Segmentation
- Marketing campaigns
- Maintaining customer relationships
- A/B testing
- Personalization
- Social media outreach
- Lead scoring
- Retargeting
You can also integrate a CDP with ad platforms and demand-side platforms (DSP) that help marketers get their message in front of the right audience. Ad platforms like Google Ads and Facebook Ads target and display advertisements within their own specific network, while DSPs offer marketers more reach with access to multiple networks across the web.
Campaigns you launch after integrating these platforms should move people through the journey to improve customer experience, retention, and loyalty – three factors affecting customer lifetime value.
In this post, you will learn how to connect the data from your CDP with advertising platforms, track the full customer journey, and plan effective marketing campaigns to move customers efficiently along the stages of their journeys.
Tracking the customer journey
We will present a generic customer journey as a point of reference to ensure all the concepts are clear. Here’s a simplified journey for an ecommerce or online retail platform:
Stage 1: Anonymous visitor
These are most likely first-time visitors to the website. They aren’t customers, and you don’t know their names, email addresses, and other personal information. The only information you have is what’s gathered via web analytics.
To find out more about collecting data for anonymous users, read our blog post:
Anonymous Tracking: How to Do Useful Analytics Without Personal Data
Stage 2: Known visitor
Although still not a customer, this visitor has been to your website before. You have collected some data, such as their name or email address, which identifies them when they visit your website.
Stage 3: First-time customer
This person has made a purchase but isn’t a repeat or loyal customer. You now have gathered information about them beyond web analytics data – such as their name, address, email, purchased product and its value, etc.
Purchase data can relate to online and offline (brick-and-mortar) transactions. As long as CRM is used to track both types of purchase data, it can be integrated with a CDP.
Stage 4: Returning customer
A repeat customer who makes occasional purchases.
Stage 5: Loyal customer
This customer makes purchases on a regular basis. They are loyal and advocate the brand.
For the customers in stages 3-5, you have data from both web analytics and CRM, the latter containing and helping you manage transaction history and customer lifetime value.
After mapping out the stages of your customer journey, the goal is to move prospects and customers to stage 5 as quickly as possible and ensure their retention for as long as possible. This is the stage where customers are the most valuable, buying frequently and simultaneously advocating the brand, improving the chance of acquiring new customers.
For more details on tracking customer journeys, see our blog post: What is customer journey analytics and why it’s important for your business.
Let’s see how a CDP can help you locate and track individuals as they move through the stages of the customer journey.
The relationship between customer journeys and CDP audiences
Many ecommerce companies use web analytics, CRM, email marketing, and DSPs that do not integrate with each other – they just exchange UTM parameters.
When these systems remain disconnected and used separately, they lead to data silos, where data sets are available to only one department, isolated from the rest of the organization. Data silos impede tracking and optimizing customer journeys, moving users forward, and increasing customer lifetime value.
One of the primary purposes of customer data platforms is integrating different technologies and allowing companies to make strategic data-driven decisions.
Is your company not using a customer data platform yet, or the CDP you have implemented is not meeting your needs? Have a look at the Customer Data Platform by Piwik PRO. Its advanced import, segmentation, and activation features, together with ensured data privacy, will help you better understand your audience and design personalized communications that resonate with it.
Comparison
Free comparison of 7 enterprise-ready customer data platforms
Get to know over 50 key differences to determine which platform fits your business needs best: Tealium, Amplitude, Exponea, mapp, Segment, mParticle or Piwik PRO.
In our scenario, we want to integrate the CDP with a CRM and web analytics platform. Before you start tracking visitors and launching marketing campaigns, you must establish what stage customers and prospects are at in their customer journey.
Break down the customer journey into stages, as we’ve shown in examples 1-5 above, and create a corresponding audience in the CDP for every stage. This way, you can place every individual – from a first-time visitor to a loyal customer – in the appropriate audience.
Translating the stages of your journey into audiences in a CDP bridges the gap between hypothetical models and real, actionable data.
We used our five-stage customer journey as an example and came up with the following grouping:
| Customer Journey Stage | Customer Data Platform Audience |
|---|---|
| Stage 1: Anonymous visitor | Audience 1 |
| Stage 2: Known visitor | Audience 2 |
| Stage 3: First-time customer | Audience 3 |
| Stage 4: Returning customer | Audience 4 |
| Stage 5: Loyal customer | Audience 5 |
There are no limits to how many stages and correlating audiences you can have in your customer journey – everything depends on your company’s strategy.
Since we’ve established the stage-audience relationship, let’s look at how the audiences are populated with prospects and customers and what data you need.
Audiences 1 and 2, containing anonymous and known visitors, do not contain customers but only visitors who have not yet made a purchase. Without transactional data from a CRM, these two audiences comprise profiles that only include data from web analytics.
On the other hand, CDP audiences 3, 4, and 5, populated with existing customers, will include transactional data on top of the analytical data.
They will require data from multiple sources:
- Web analytics data showing customers’ behavior on your website or app.
- CRM or ecommerce data showing their transaction history.
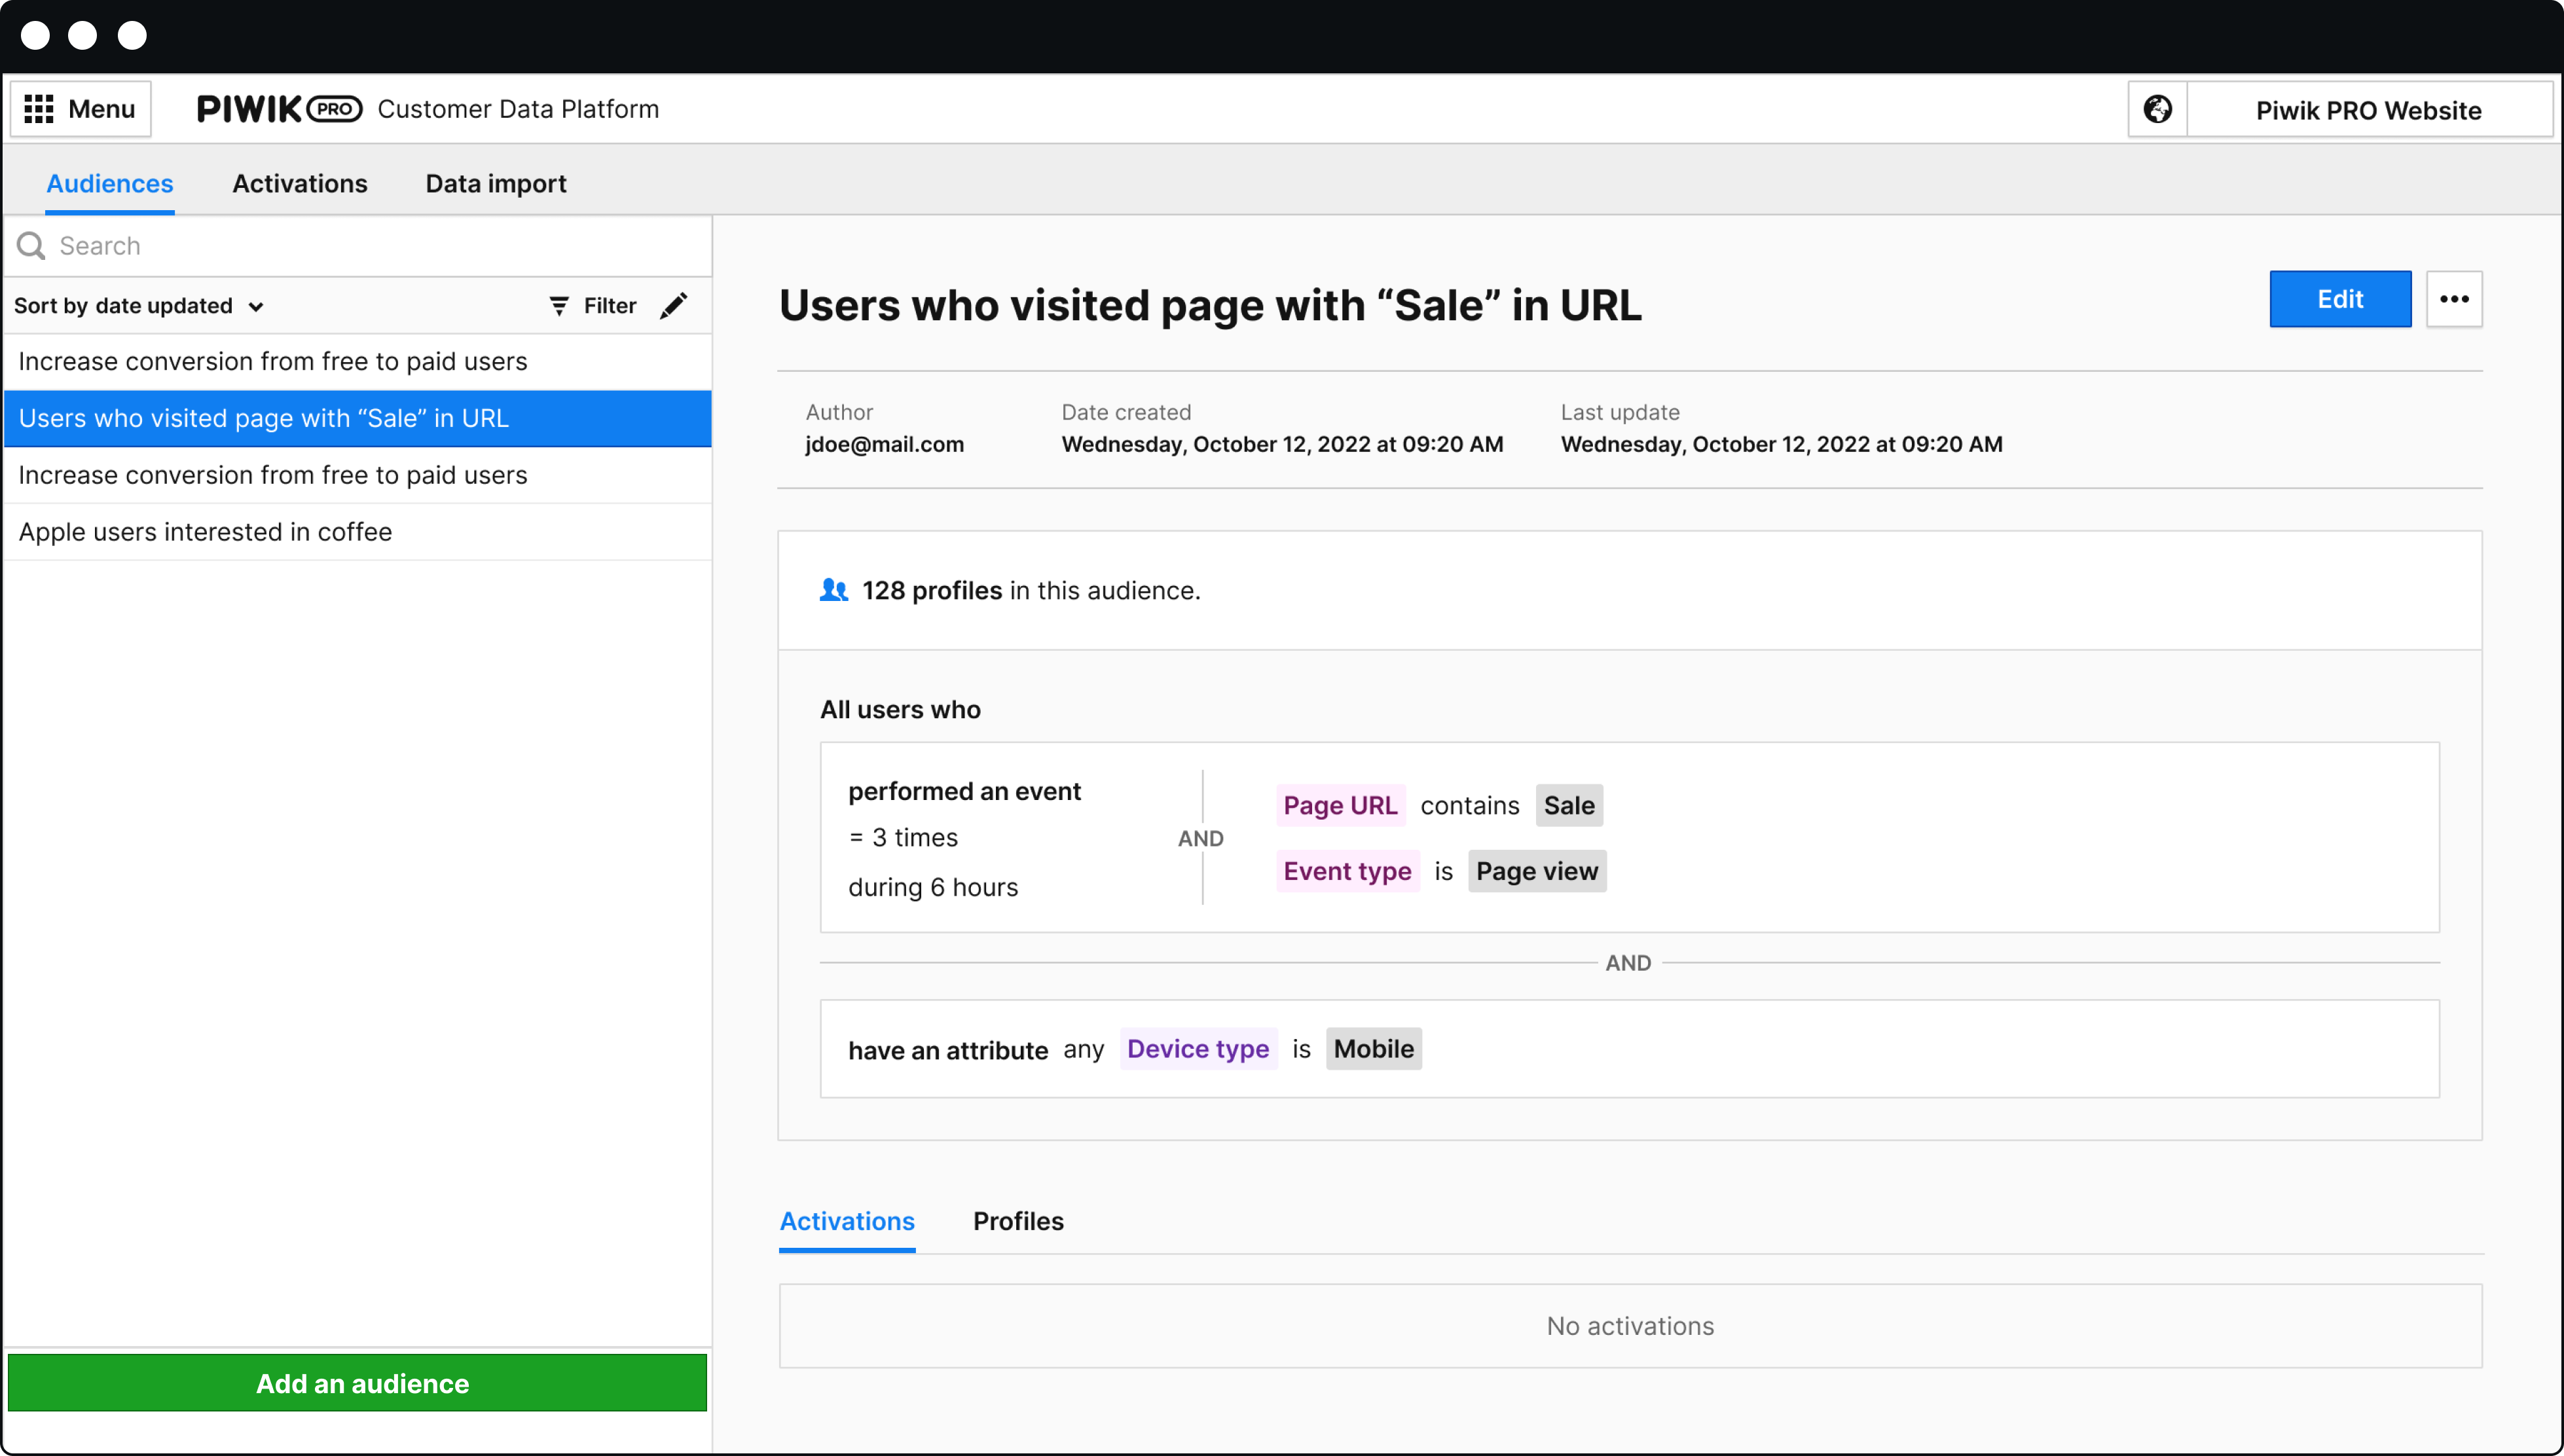
By configuring and integrating your CDP with CRM and web analytics, the CDP can:
- Connect web analytics behavioral data with CRM transactional data.
- Track how individual customers move through audiences and how they progress along the customer journey.
- Record individual customer lifetime value.
The prospects and customers are now segmented into advanced audiences. So, how can we influence them to progress to the next audience – or move along the customer journey stages – ultimately boosting purchase frequency and lifetime value?
We have a post explaining how to conduct audience targeting in more detail: How to perform successful audience targeting with a CDP.
Integrating the customer data platform with ad platforms
Data activation involves analyzing data to develop insights and convert them into actions to unlock value for the business.
You can activate your data by connecting your CDP to other tools and platforms and engaging with customers across many touchpoints, such as email campaigns, personalization, on-site retargeting, CRMs, internal channel communication, social media, and advertising.
In our case, we will consider activating customer data by integrating the CDP with ad platforms – specifically, Google Ads. Activating CDP audiences in ad platforms links your audience segmentation and tracking to outbound marketing efforts.
After you export the audience data, the ad platforms will start mapping users. In other words, they will begin looking for the provided user profiles within their own networks.
In the example below, we’ve taken our “Anonymous” audience and uploaded it to Google Ads. You can see the networks in which Google found users from this audience.
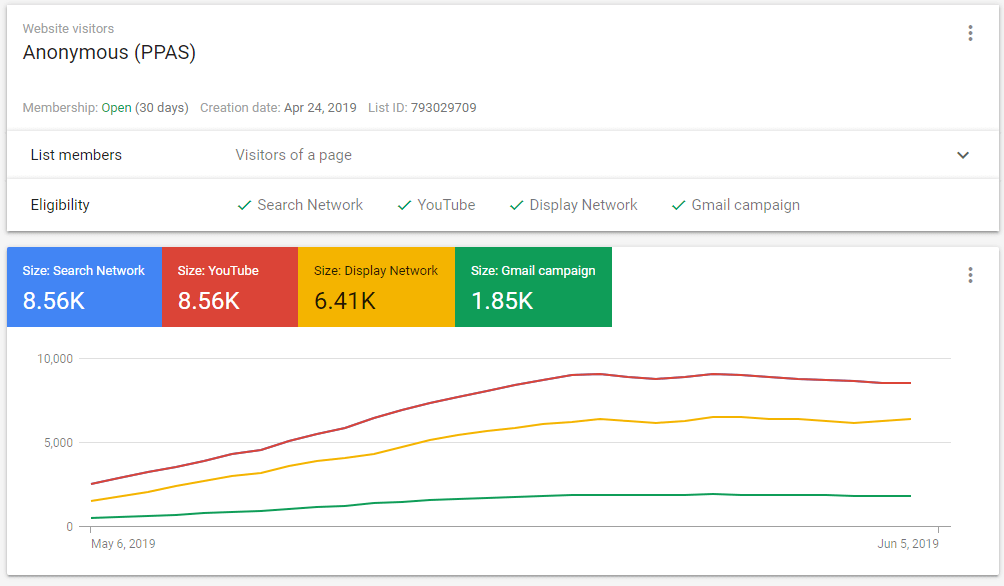
Once DSPs and ad platforms have the audience members mapped, you can see the size of the audience targeted for each type of campaign. With all this information, you can launch laser-focused retargeting campaigns for individual audiences.
We’ve prepared a technical guide explaining how to connect the CDP with ad platforms to launch a remarketing campaign – be sure to check it out: How to Create Targeted Campaigns by Integrating Customer Data Platform with Ad Platforms.
Let’s follow the steps of a retargeting campaign after integrating the CDP with ad platforms. Carrying on with our example, we will plan actions to get members of Audience 1 to work their way down to Audience 5.
Each audience has its own campaign. As users move from one audience to another, they are automatically added to the retargeting campaigns for their audience and stop seeing the previous campaigns.
Keeping track of anonymous visitors
A first-time visitor comes to your ecommerce site. All you know about this individual is what’s been captured via your web analytics platform – you don’t have their name, email, address, etc. There is no record of this visitor in your CRM yet; they aren’t customers and are assigned to “Audience 1: Anonymous user”.
Two things automatically happen as a result of this visit:
- A single customer view is generated for the visitor in the CDP platform. It will serve as a link between web analytics, CRM, and transactional data and will be responsible for tracking the full customer journey of this specific user.
- Audience 1: Each single customer view meeting the conditions set up for Audience 1 – anonymous user, most likely first-time visitor to the website, not yet a customer – will automatically be added to Audience 1.
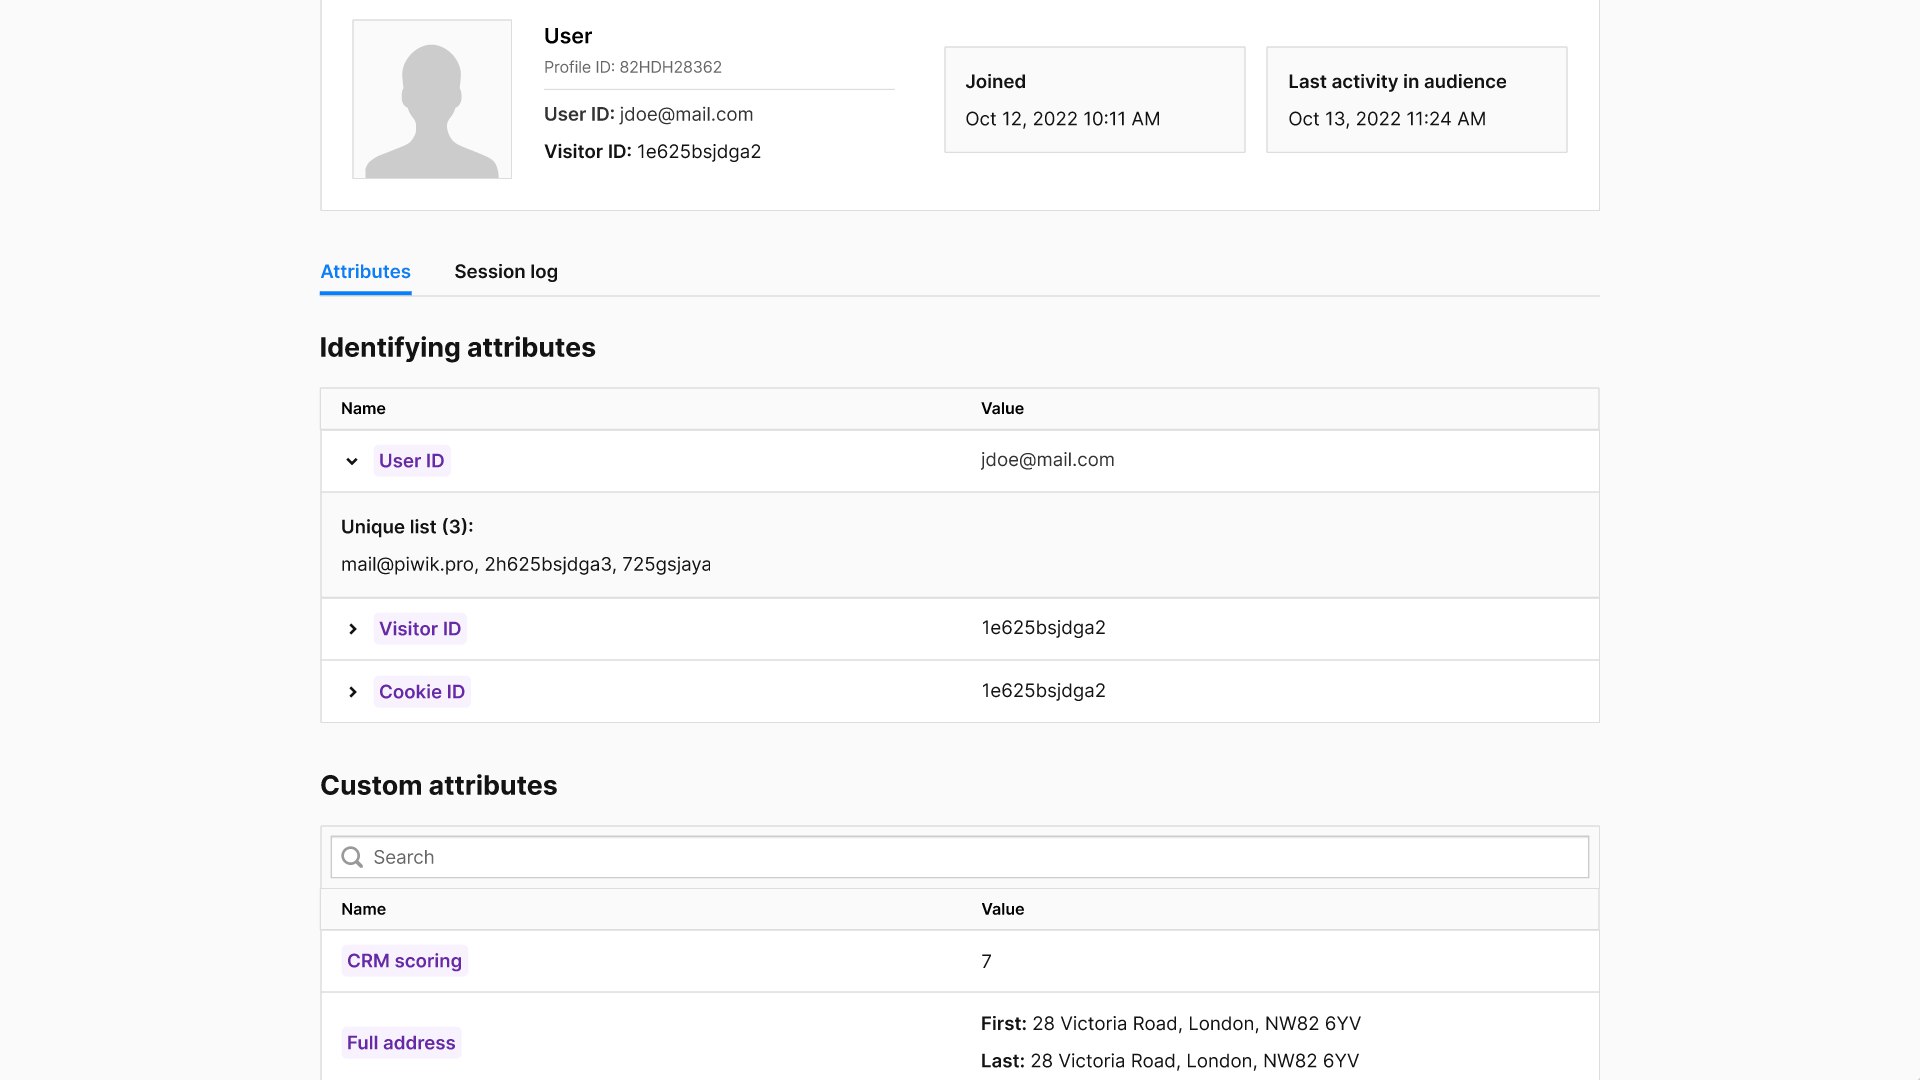
For more information on what customer profiles consist of and how you can use them, check out our post: Single customer view (SCV): what is it and how does it work?
On the CDP side of things, users are segmented into different audiences that correspond with journey stages and tracked as they move through them. You also have a detailed single customer view for every individual in all the audiences.
How do you convert unknown visitors to customers and increase customer lifetime value? By activating your data through integration with the ad platform.
Converting from anonymous to known visitor
An anonymous visitor viewed your store, visiting several product pages and then leaving without making a purchase. You want to help move this visitor to the next customer journey stage – “Audience 2: Known visitor.”
To get this visitor’s information – or, better yet, have them make their first purchase – send anonymous users from Audience 1 to an ad platform like Facebook Ads, Google Ads, or DSP and launch a retargeting campaign.
Some strategies to gather the data needed to identify the visitors include:
- Encourage visitors to subscribe to your newsletter and get a discount on their first purchase.
- Ask visitors to sign up for your upcoming webinar or another event.
- Get visitors involved in a prize competition on social media.
- Convince visitors to purchase a “tripwire” offer – typically an inexpensive offer that “gets your foot in the door” and creates the opportunity for upselling or cross-selling.
Once we collect basic CRM data like email, name, and perhaps also address, it will also appear in the single customer views in the CDP. At the same time, each user profile is assigned to the appropriate audience, which in this case is Audience 2 (Known visitor).
From a known visitor to a first-time customer
You’ve managed to engage visitors with your brand, but how do you get them to convert?
Here are the possible objectives for campaigns focused on turning known users (Audience 2) into first-time customers (Audience 3):
- Incentivize the known users to take advantage of a “first-time purchase” discount.
- Target the users with content that highlights the benefits of buying from your company, like free shipping, competitive pricing, or unique products.
- Show relevant product recommendations for each visitor based on their previous interactions with your company.
If successful, this campaign will take known visitors to the next step in their journey. As soon as they make their first purchase, their single customer profile is again updated with the acquired information and moved to Audience 3.
Getting first-time customers to come back
To help first-time buyers become repeat customers, you can:
- Provide discount and promotion codes applicable to the customer’s second purchase. Send these right after the first purchase: customers who’ve made one purchase are more likely to make another.
- Promote cross-selling offers using ads or email marketing.
- Offer a rewards-based loyalty program for returning customers.
- Communicate with customers after the first purchase. For example, request their feedback to find out what you can improve about your offer or craft useful content for your newsletter featuring your new products and upcoming promotions.
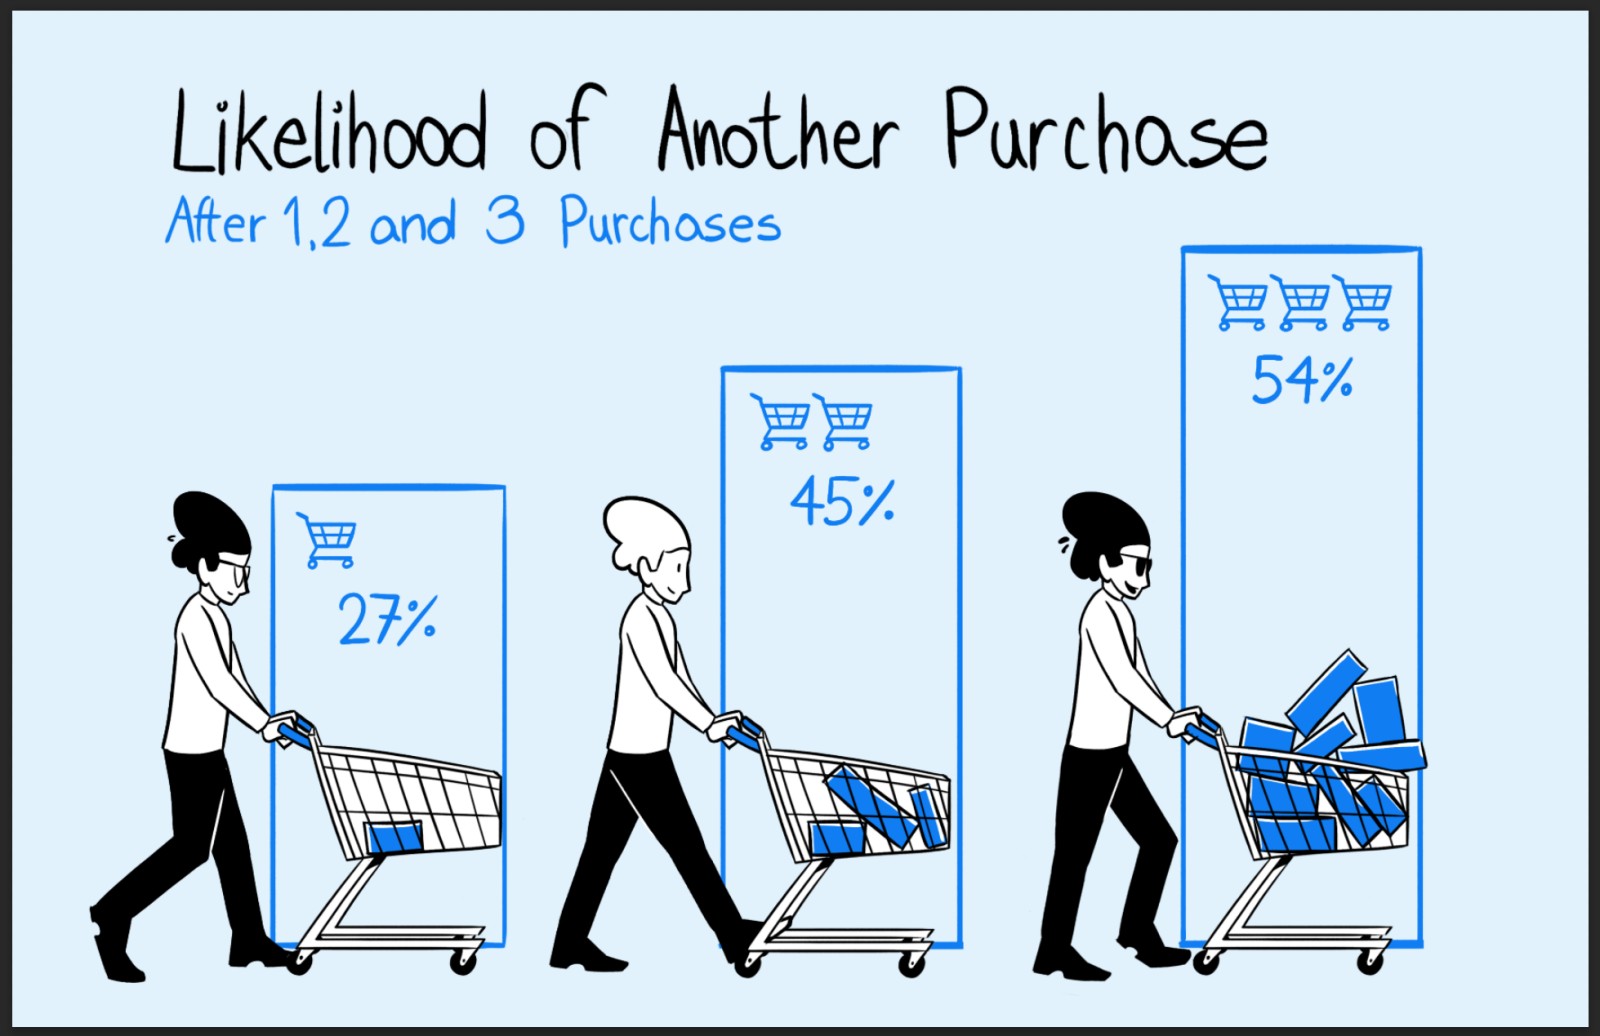
This campaign’s main goal is to retain customers and increase their lifetime value by encouraging more purchases.
Again, single customer profiles are assigned to audiences based on the specified conditions. In this case, after a second purchase has been made, the individual’s profile is moved to Audience 4: Returning customer.
How can you influence brand advocacy?
The final step is making returning customers into brand advocates. Advocates elevate the brand through word-of-mouth marketing and other advocacy methods, spreading positive reviews and helping refer new customers.
Ensure you provide a consistently good customer experience with every aspect of your product and brand – for example, by resolving customer issues quickly.
Some potential strategies for the campaign targeting this audience could include:
- Asking for new customer referrals in exchange for discounts and gifts.
- Encouraging feedback on social media or a rating website, or acquiring testimonials, typically in exchange for incentives such as promotions, extra products, or features.
Success at this stage means bringing in new customers referred by your current customer base, driving word-of-mouth marketing, and increasing your brand’s social proof on social media and rating websites.
Conclusion
You can see how to integrate and customize tools you already use, like web analytics, CRM and CDP, to create automated marketing campaigns. By activating customer data, you get to group customers, monitor their customer journey, and influence them to take the next step.
We hope this post has shown you an example of how some “outside of the box” thinking can help you extract more data and insight from your platforms and better understand how customers interact with your brand.
Have any questions about Piwik PRO’s integration with ad platforms or other ways you can use it to better understand your customers?
Don’t forget to check out the Piwik PRO blog and read about other ways customer data platforms can help you achieve your business goals:
- Single customer view (SCV): what is it and how does it work?
- How analytics & customer data platform can help you track the full customer journey
- What is data activation and how does it fit into your data analytics stack
The post Integrating your CDP with Ad Platforms for Customer Journeys that Convert appeared first on Piwik PRO.
]]>The post How to find website conversion problems with cross-device & cross-browser reports appeared first on Piwik PRO.
]]>Or they leave because the headline is from another campaign – a copy and paste error! It can happen even at the best sites, but it has fatal consequences as visitors leave immediately and may not come back.
The key is to eliminate such usability issues. And this should come before you try to fix anything else. As noted by Peep Laja from ConversionXL,
Bugs – if they’re around – are your main conversion killer. You think your site works perfectly – both in terms of user experience and functionality – with every browser and device? Probably not.
You just need to make sure your site is user-friendly at first sight. Easier said than done. But actually it’s pretty simple if you take a little help from analytics.
That’s why we want to present a couple of analytics reports that you should include in your arsenal. We’ll show you how to set them up and use them right, so that your customers go smoothly though your site and come back again and again.
You need strong pillars to support your technical analysis. Cross-Device, Cross-Browser and Page Speed Reports are exactly these pillars. They’ll help you quickly find the stumbling blocks new visitors encounter.
Once discovered, you can fix them on the spot and let users glide through your sites and reach their final destination.
We’ve prepared this use case with a strong focus on Technical Analysis. It’s a crucial part of the ResearchXL model, a powerful conversion research framework that let analysts and marketers set the right direction for conversion optimization.
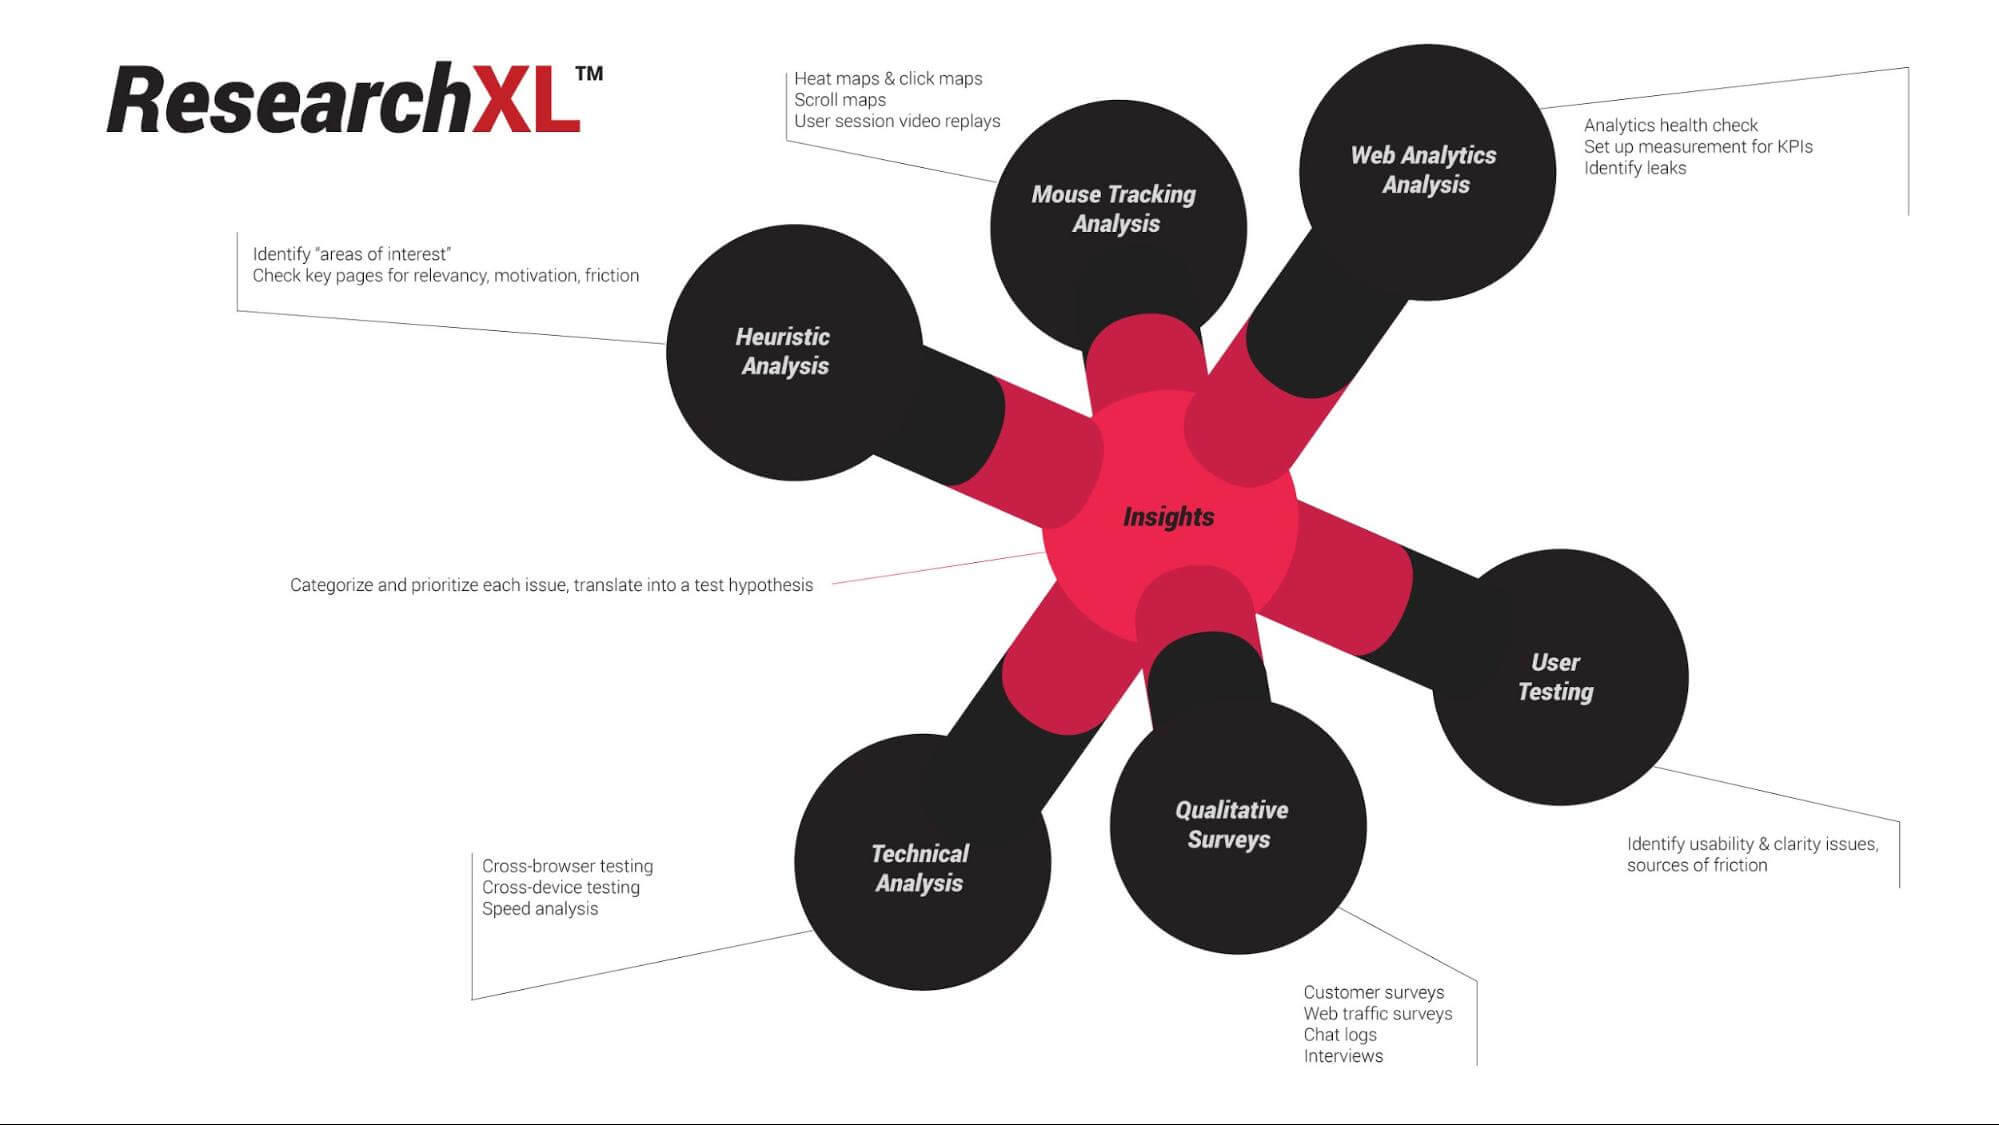
A little background on running analytics reports
Before we dive into the details, there’s one thing to keep in mind. Analytics reports tell us where the problem is, but they rarely explain why the problem happens. The same rule applies to this particular report. It tells us which landing or entry pages are making a bad first impression and are causing users to bounce off.
Free Comparison of 5 Leading Web Analytics Vendors
Compare 40 Variables of 5 Leading Enterprise-Ready Web Analytics Vendors:
So, you get a little hint about why it may be happening, but not the full answer. The First impression report helps you figure out:
- whether your landing page is user-friendly on mobile/desktop
- whether there are certain browsers causing your landing page to break
In a nutshell, such analysis lets you eliminate usability and functional issues that prompt the user to bounce off your page. These can be all kinds of issue, like a menu that doesn’t work or pages that take too long to load.
The report may also reveal that people bounce off your site because it breaks on iPhone 7 with iOS 11.2. That’s an easy fix for your developers and a low-hanging fruit of conversion optimization.

Apply the cross-device report to check if a device causes conversion troubles
Enough theory.
Now it’s time to put all this information into action. We’ll guide you through the whole setup of each report to make sure you have things right from the beginning. Here we go!
Step 1. Pick the right metrics
First, you need to select the right metrics from the list and put them on a drag & drop placeholder. You should select:
- Entries
- Bounce rate
- Goal Conversion Rate*
*Of note, Goal Conversion Rate is applicable when conversion goals are already being tracked.
Step 2. Set the proper dimensions
Now it’s time to choose from the following dimensions:
- Session entry URL
- Device type
- Device brand
Then, one by one, drag and drop them to the dedicated placeholder. Here’s what you should end up with:
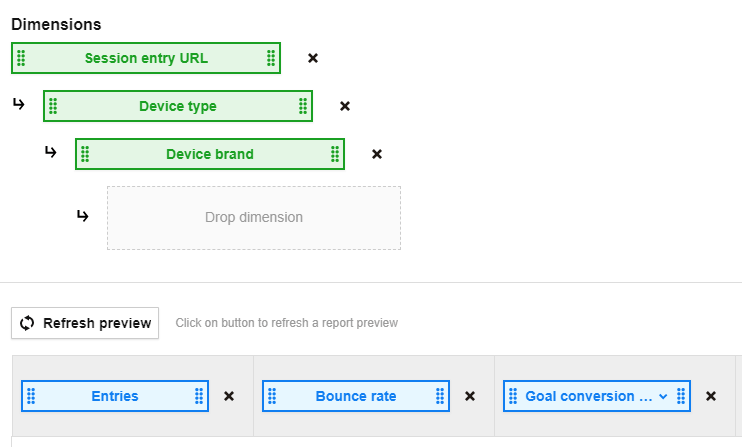
Step 3. Looking for high bounce rate red flags
Once you set up the report it’s time for analysis. But before we move on, click the label in the Entries column and sort all the landing pages from the ones receiving the most traffic to the ones that are the least visited.
What you should be looking for are landing or entry URLs with extraordinarily high Bounce rate . Namely, rates that exceed the average bounce rate for the whole website and with conversion rates below the average value for the whole website.
Now, let’s see what our setup reveals:
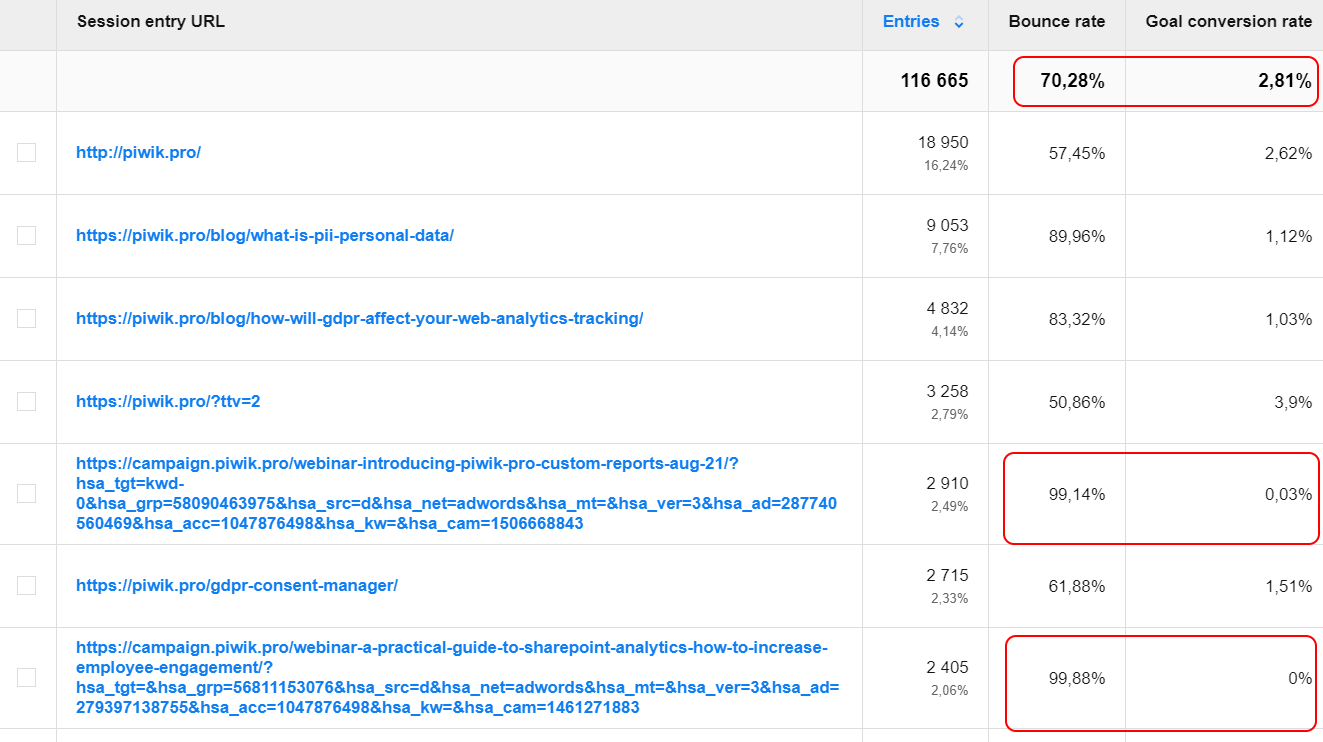
Just a glance is enough to see a red flag. Although it’s only the first screen of the report, one specific landing page is already screaming out for a closer look.
Free Comparison of 5 Leading Web Analytics Vendors
Compare 40 Variables of 5 Leading Enterprise-Ready Web Analytics Vendors:
It grabs our attention for three reasons:
- It collects a significant amount of traffic. In other words, it’s a very popular entry point for the piwik.pro website
- The landing page has a significantly lower conversion rate than the website average. The average conversion rate for this URL is 0.03% whereas for the website overall it’s 2.81%.
- The bounce rate for the analyzed URL is 99.14%. This is almost 30% higher than the website’s average.
That’s how you can find where the conversion problem is on your website. So now we’ll try to figure out why it happens and see if there is an easy fix to lower bounce rates and lift conversion rates.
Step 4. Can we blame the device type for conversion issues?
It’s time to dig a bit deeper and figure out if it’s device type causing such a high bounce rate and low conversion rate.
Have a look at the lower level of our report. Here’s the traffic to this particular landing page, broken down by the type of device visitors browsed the page on. As you narrow down your traffic and create granular segments you’ll be able to better focus on finding the precise cause of your site’s issues.
Note: Every time you go deeper into your report it means you’re segmenting your traffic. You can do it according to your preferences and the particular purpose(s) of reporting. In this way you get more detailed views on the situation you want to analyze.
Now you need to find red flags based on the average bounce rate. That’s why we analyze what device people used while visiting our URL.
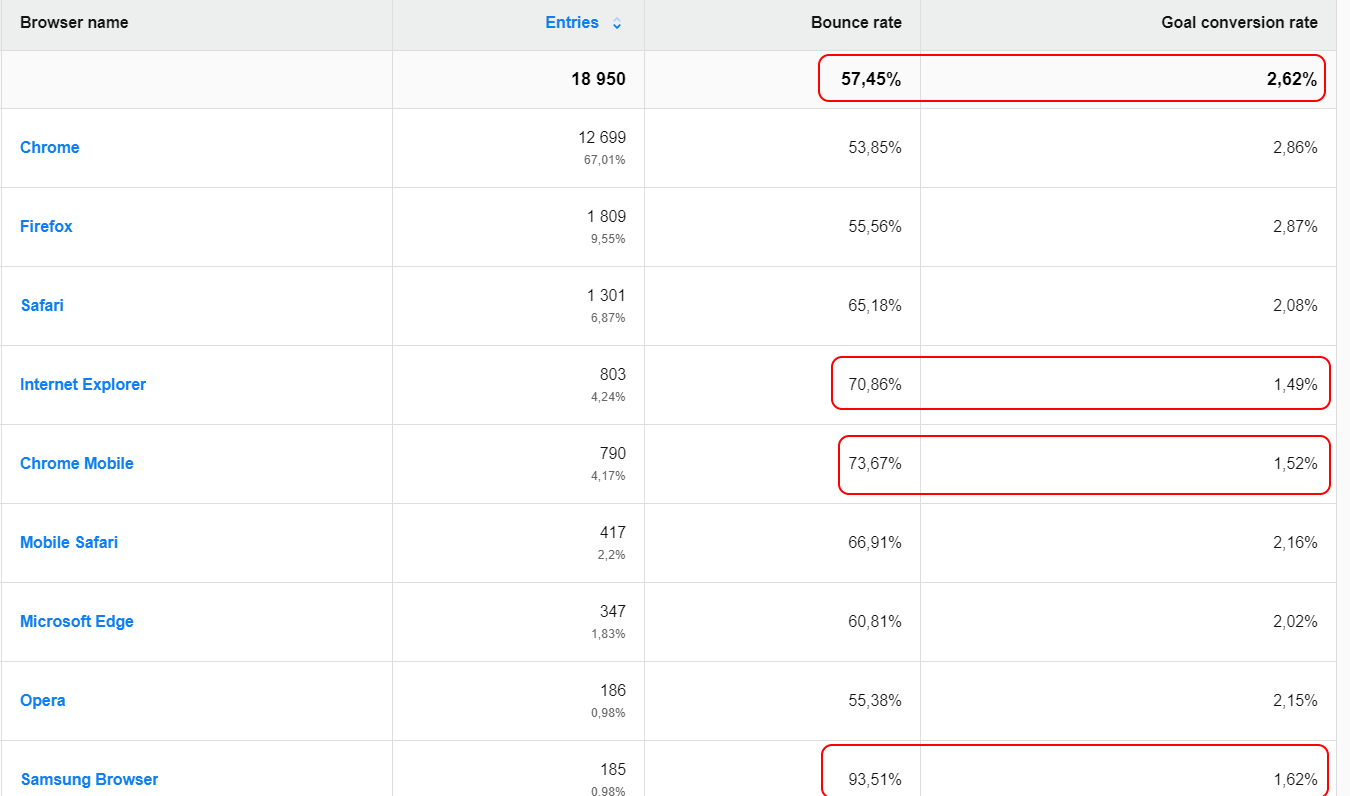
It turned out that the majority of users visit this page via smartphones. And the bounce rate for mobile devices, which is about 75%, is much higher than for desktop devices, which is roughly 56%.
So we’ve got some clues, but still we can’t clearly state that user experience is broken because the landing page is not suitable for mobiles. In this case, performing some cross-device testing would be a good step. But for now, let’s move on with some other reports to get more answers.
Step 5. Can we put the blame on device brand for causing conversion problems?
Ok, once you know which device is causing your major bounce rate, you should drill down further and divide up devices by brands. By narrowing your traffic and precisely segmenting it, you create meaningful chunks that you can carefully analyze.
The principle of cross-device testing is that you need to look at one device category at a time. Use device segments: desktop, mobile, tablet, etc.. Viewing each device in isolation generates clear results and devices won’t get lost in averages.
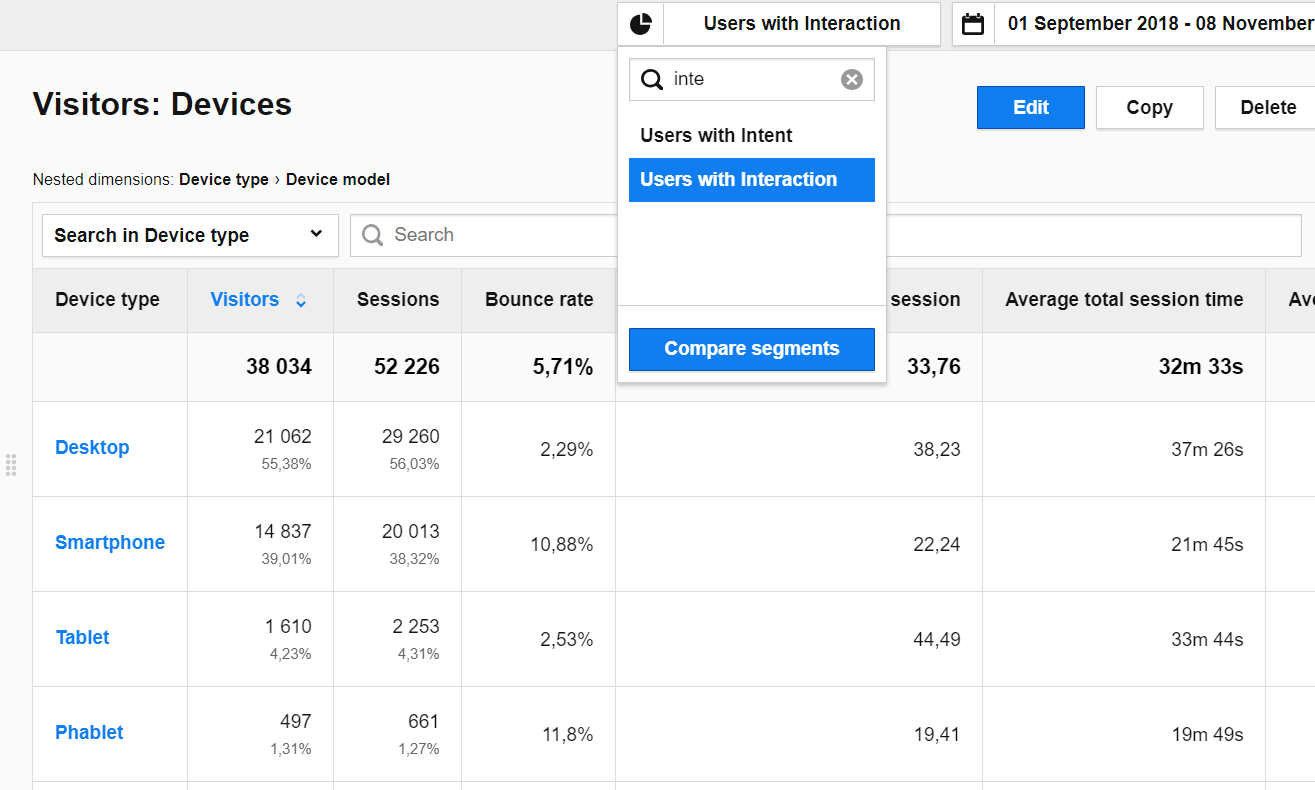
So, have a look at the report after you’ve applied segmentation.
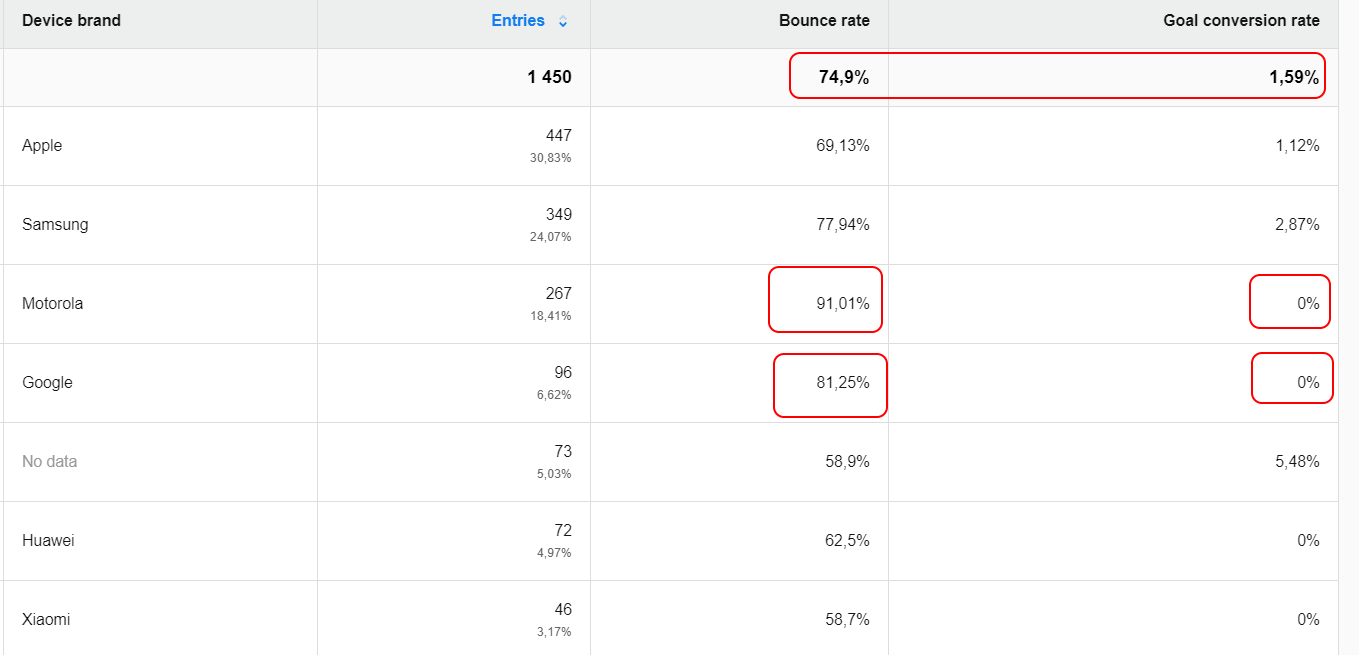
First of all, the majority of users browse the page on Apple devices. Just a glimpse at the report shows us that the dubious honor of first place, with a bounce rate of 91.01%, belongs to Motorola with a 0% conversion rate.
When comparing to the average 74.9% bounce rate, we realize that we still don’t have an answer and we need to move on with our analysis.
So what now? Discovering an underperforming site is great for further CRO research. Some issues with high bounce rates can have their roots in cross-device issues. The user experience might be broken on some pages in the case of users who browse them on Motorola or Google phones.
Cross-device issues only provide clues. Your job is to look deeper to find out where you have those problems and why they happen. For instance, you can take advantage of tools like crossbrowsertesting.com and browserstack.com to check where the problem lies. To complete the whole process and validate your findings you should also include heuristic analysis.
Still not sure how to handle segmentation? Take a look at our guide and review some more material about segmentation in Custom Reports.
Is a browser the culprit of your conversion problems?
You’ve already done some analysis but we still don’t have a straightforward answer to why our page is getting such a high bounce rate and few conversions. So it’s time you turn to cross-browser testing. This is the second pillar of technical analysis and it helps you to get a closer look at different internet browsers.
It’s crucial to make your site – whether mobile or desktop – fully functional and to ensure that everyone visiting it gets a great experience. Since not all browsers are equal, for instance they interpret code in different ways, this can cause some experience issues.
However with cross-browser reports you can spot these bumps on the road and fix them in stride. You should check whether a particular browser converts better or worse than others.
Step 1. Pick the right dimensions
As to the first steps of the set up, select the required dimensions from the list then drag & drop them on the placeholder. Choose:
- Session entry URL
- Browser name
- Browser version
Since you can use the same metrics as in the previous report, your final setup should look like this:
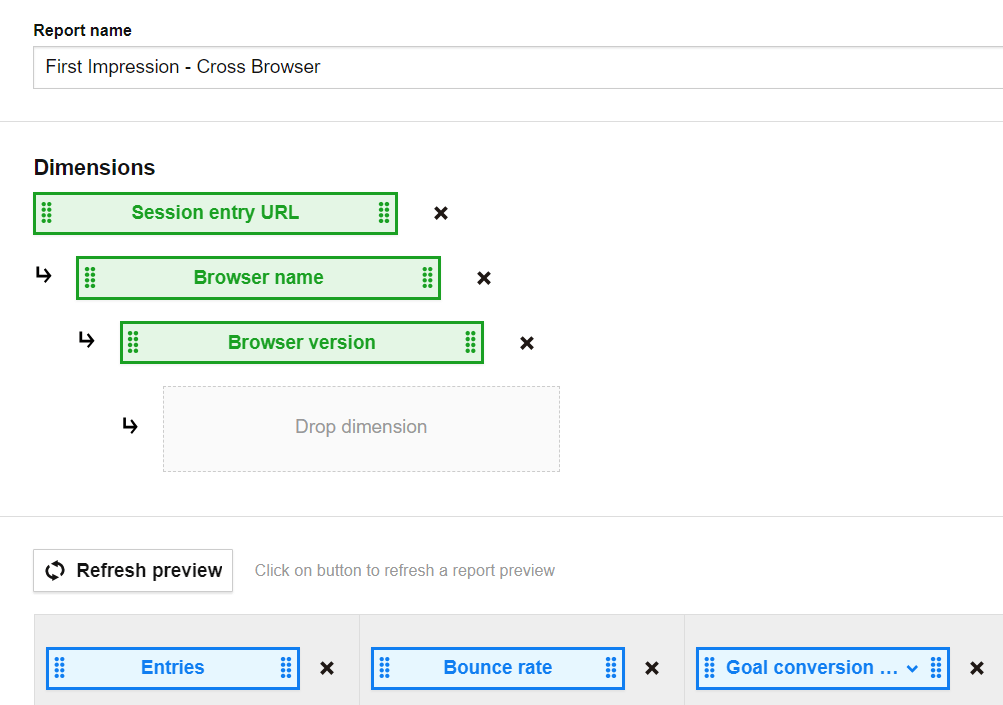
Step 2. Search for warning signals – high bounce rates.
Now, with a complete a report at your fingertips, look for pages with the highest bounce rate and low conversion rate.
With just a quick look you can spot two pages that require your attention. The page that jumps out first reports a 99.88% bounce rate and doesn’t convert at all. That’s why we need to dig deeper to find out what’s going on.
Step 3. Check if it’s the browser creating conversion issues
Once you know which page makes visitors bounce, drill down and analyze if a particular browser is to blame.
And here you can see right away that Samsung Browser has the highest bounce rate, at 93.51%, followed by Internet Explorer and Chrome Mobile, while the average rate is 57.45%.
Again, you might wonder if the problem is that the banner doesn’t scale right on Samsung Browser. Maybe it’s too big, it covers some key buttons and the user can’t actually browse the site. With such a high bounce rate you can expect some major issues, but at least now you know that Chrome users manage quite well.
The good news is, you don’t need to have direct access to all devices and browsers in order to run tests. You can simply use crossbrowsertesting.com and browserstack.com.
After these tests you can figure out where the problem might be, but you still don’t know why it occurs and what can you do to improve it. You need actionable insights, and a simple where is not enough. You need to know how to act on the data you have.
That’s why you should invest time into further analysis using methods like functional QA, heuristic analysis and qualitative research.
Does page speed cause conversion problems?
Since you still don’t know why your page is underperforming, it’s time to look from another perspective, that of page speed. That’s the final pillar of the analysis.
First of all, why you need to analyze it? The loading time of a site is one of the ingredients in user experience. If it’s too long, the experience is poor and users won’t bother to wait, so they bounce off your site.
Page load time has a tremendous impact on conversion – as a 2014 report found, 57% of users will abandon a page if it takes longer than 3 seconds to load.
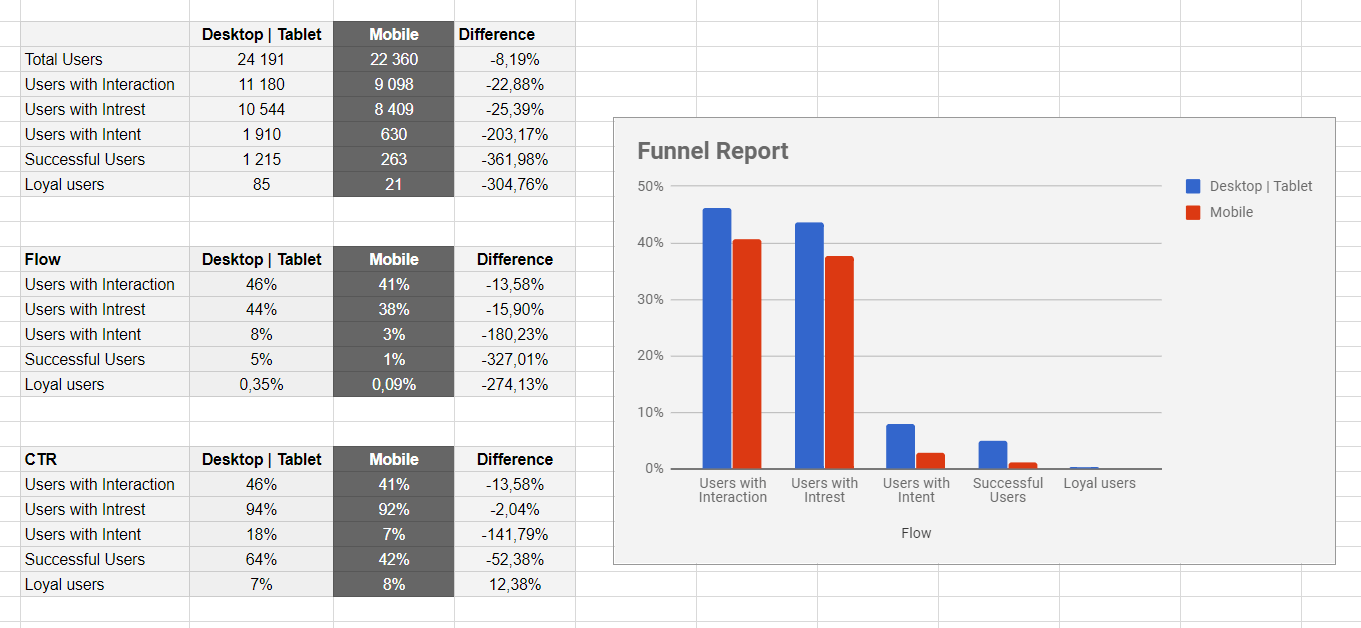

That’s why a Page Speed Report comes in handy. And to help you out, we’ll show you a simple setup first.
Step 1. Choose the correct dimensions
First, choose the appropriate dimensions and drop them on the placeholder:
- Page URL
- Device type
- Device model
Step 2. Get the right metrics
Next, pick from the list metrics like:
- Page views
- Bounce rate
- Average page generation time
Note: matching bounce rate with average page generation time makes a powerful duo.
You should end up with a setup that looks like this:
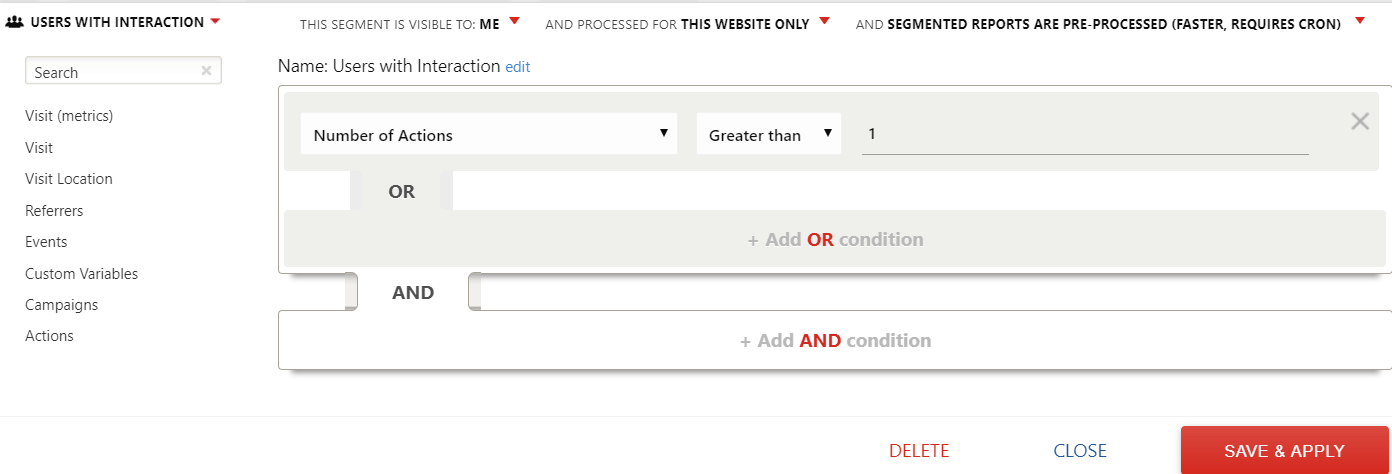
Step 3. Spotting the red flags – high page generation time
Once the setup is done, have a look at pages that load too long. In other words, they have an unusually high generation time in comparison to the average.
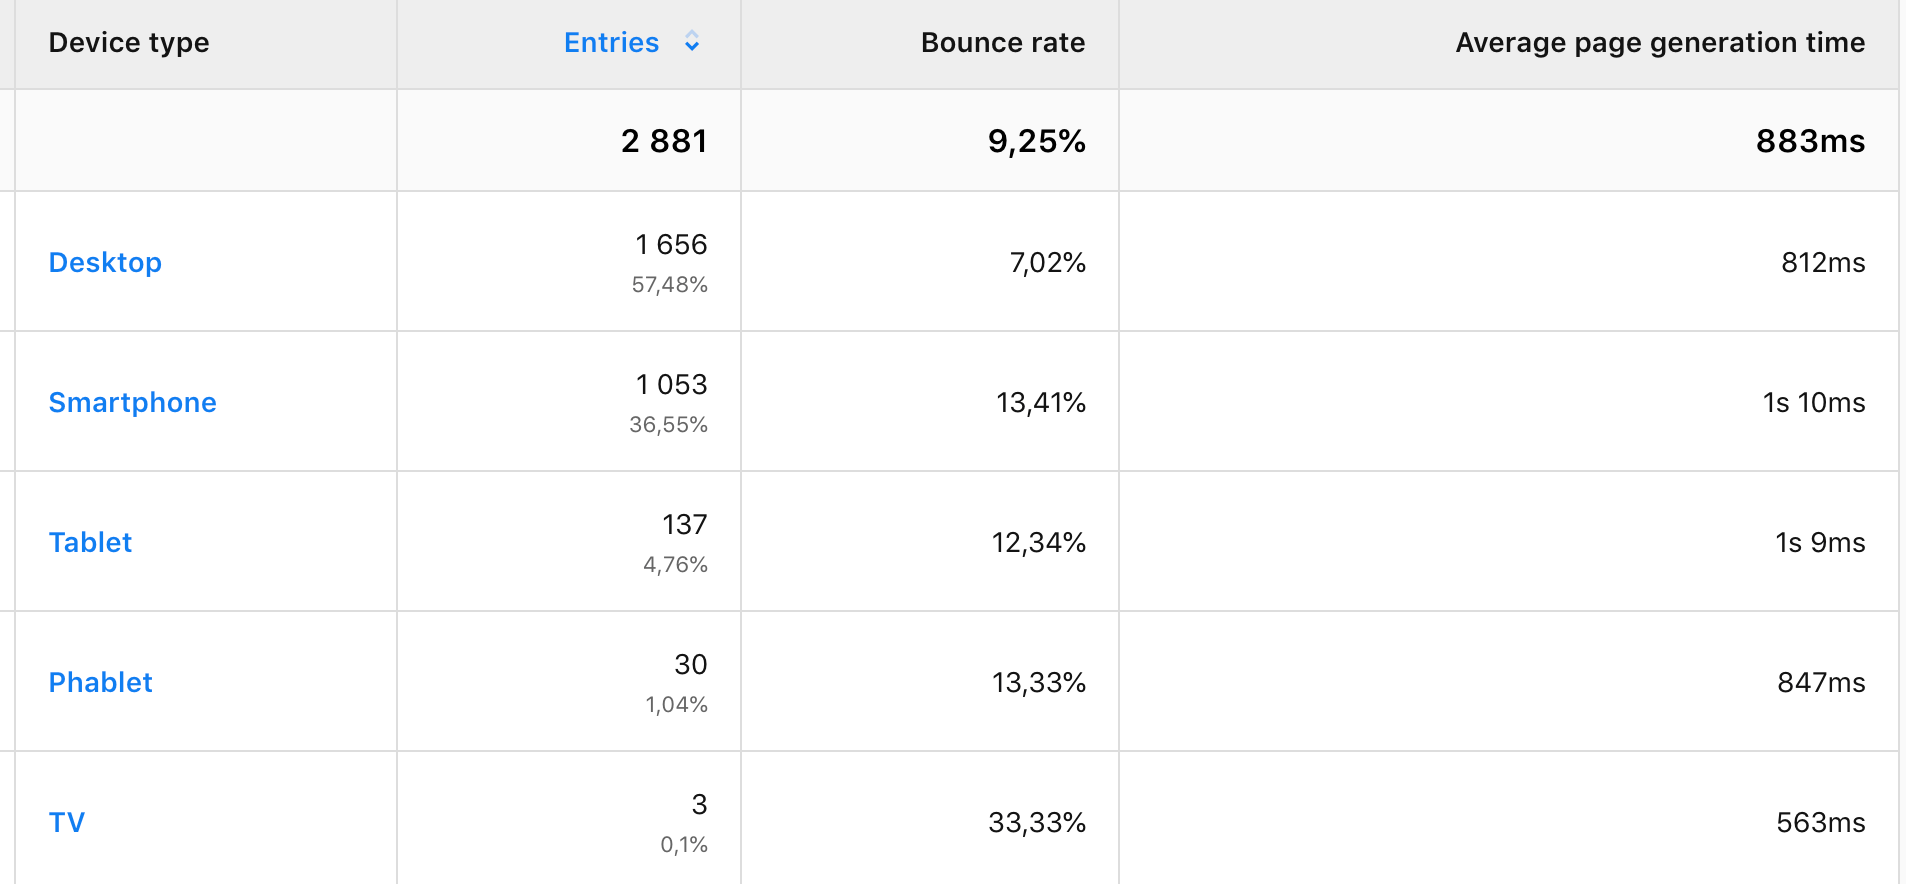
Here you can clearly see the page that takes way too long to load. With an average time of 1s 55ms, our URL achieves a rather poor result of 1s 162ms loading time.
Step 4. Look at cross-device differences to find page speed issues
As soon as you find which page has trouble with loading time, you should check if it’s linked to a specific device.
So, have a look at what your report says.
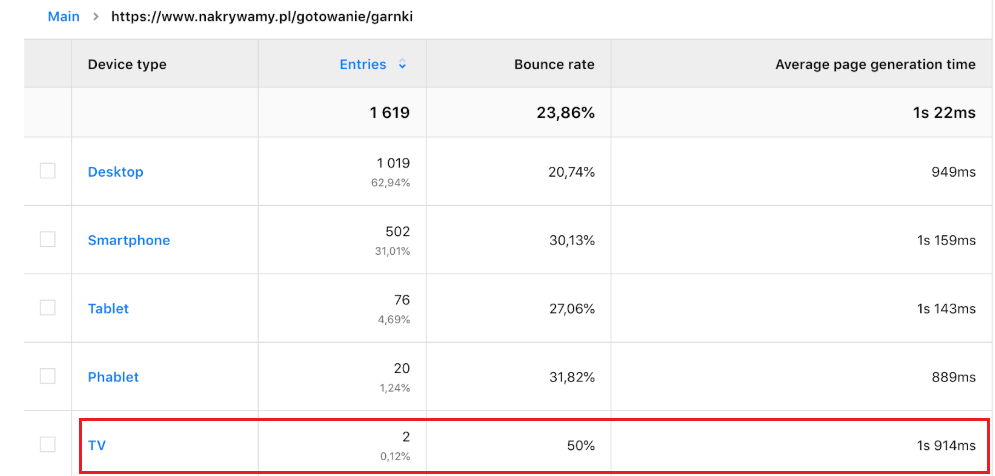
The numbers speak for themselves, and TV seems to be the troublemaker. Page generation time here is 1s 914ms. Compared to average time this result is way too long.
Take a look at one of the reports reviewed by Yehoshua Coren from Analytics Ninja:
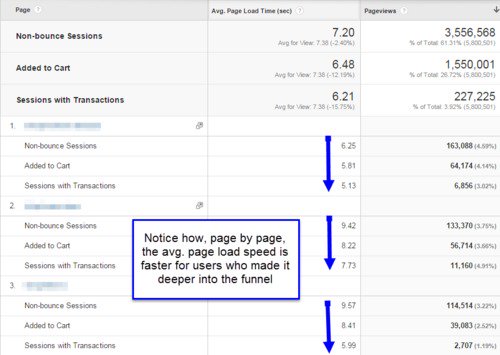
He compared the page load speeds of users who made it through different stages of the conversion funnel. What you get from this report is that page load is faster for customers who mange to go deeper through the funnel.
Pay special attention to pages that take so long to load so you can dig for more clues later on. Then get even more insights when you apply segments. Check whether certain devices have slower load times, or maybe it’s a matter of particular browsers, countries, etc.
Even if you can’t answer all these questions at once, you’ll still get some valuable hints. At least you’ve found room for improvement, namely you’ve identified which devices you should optimize for to provide a better experience to visitors and keep them on your site.
Free Comparison of 5 Leading Web Analytics Vendors
Compare 40 Variables of 5 Leading Enterprise-Ready Web Analytics Vendors:
If you’re wondering what you should do next, try to do a reality check on your web analytics findings. In other words, take advantage of tools available on the market and test the speed of your website, both on desktop and mobile devices. You can find various tools to help you with this job:
- https://testmysite.withgoogle.com/intl/en-gb
- https://developers.google.com/speed/pagespeed/insights/
- https://tools.pingdom.com/
Conclusion
We’ve tested the landing page to check why customers stumble when they come to your site for the first time. There could be many reasons why you’re experiencing high bounce rates and low conversion rates.
So eliminating real culprits like device and browser types is a good start.
But you need to dig deeper. Perhaps the landing page to ad copy mismatch report will lead to more answers.
The good news is that your effort has not been a waste. You’ve gained some significant insights. For instance, you’ve found out which pages work well, and these can pave the way for your optimization strategies.
Making a good first impression with your site might be tricky, but we hope that with this post we’ve helped you out a bit. We’ll soon have some more actionable advice and other cases to solve, so stay tuned. And if you’re eager to get some more answers now, just
The post How to find website conversion problems with cross-device & cross-browser reports appeared first on Piwik PRO.
]]>